Automated Classification of Waste Wood Composites: An Evaluation of Hyperspectral Imaging and Deep Learning Pipelines
New collaborative research between UBC and Metaspectral evaluates near-infrared hyperspectral imaging and deep learning pipelines for automated classification of post-consumer waste wood composites, achieving up to 100% accuracy under controlled conditions and 91.2% on real landfill material.

Guillaume Hans
Senior Research Scientist
Construction, renovation, and demolition (CRD) activities generate one of the largest solid waste streams in Canada [1]. In the Metro Vancouver region, one-third of all municipal waste sent to landfills originates from CRD activities [2]. Wood waste comprises nearly 48% of that total CRD stream [3]. At the Vancouver Landfill specifically, plywood (21%) and dimensional lumber (32%) were dominating the wood waste piles [4].
Because wood is an exceptional, naturally renewable carbon sink, diverting it from landfills not only extends its carbon-storage lifecycle for decades but also represents a vital opportunity to keep the material's inherent structural and economic value active within the economy. British Columbia's CleanBC framework [5] and the Canadian Council of Ministers of the Environment (CCME) [6] have outlined supportive policies in this direction. These frameworks actively encourage the recovery of post-consumer fiber to reduce landfill emissions and promote the circular bioeconomy.
1. The Technical Challenge: Salvaged Wood Contamination
To safely integrate recycled fibers into manufacturing streams, exceptionally clean feedstocks are required. However, salvaged wood may carry chemical contaminants. It may contain chemical preservatives like Alkaline Copper Quaternary (ACQ) or be bound with different synthetic adhesive resins like Phenol Formaldehyde (PF), Urea Formaldehyde (UF), or Melamine-Urea Formaldehyde (MUF). Moreover, at the landfill, weathered wood quickly turns grey and dirty. Therefore, the primary technical challenge in realizing this circular economy is accurate, automated sorting.
2. The Automated Solution: Hyperspectral Imaging
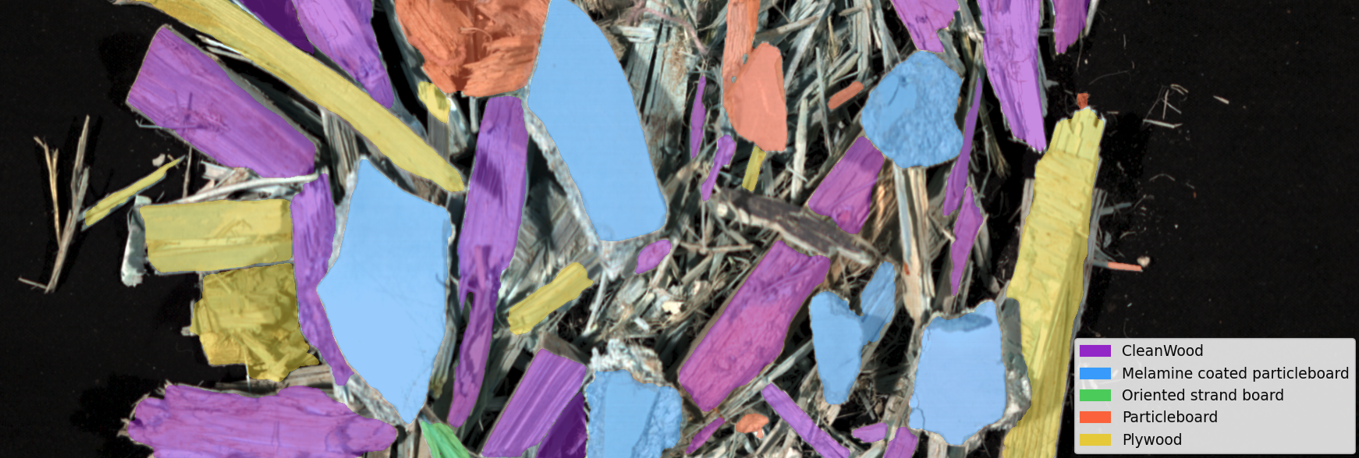
Automated sorting of post-consumer wood composites is a highly complex chemical and structural classification problem. In industrial waste streams, materials such as oriented strand board (OSB), plywood (PLY), particleboard (PB), and melamine-coated particleboard (M-PB) are frequently mixed.
New collaborative research between the University of British Columbia (UBC) and Metaspectral demonstrates how near-infrared hyperspectral imaging can overcome industrial wood waste sorting barriers [7]. In this study, we provide a technical evaluation of Near-Infrared (NIR) Hyperspectral Imaging (HSI) combined with deep learning architectures to classify these materials under varying operational complexities.
While normal cameras only capture light in three channels (Red, Green, and Blue), near-infrared hyperspectral imaging (HSI) cameras capture hundreds of contiguous, narrow wavelength bands across the spectrum and in a two-dimensional space. The resulting data structure is called a hypercube: a 3D image where every single pixel contains a highly detailed chemical "fingerprint" (its spectrum).
This technology can instantly read the molecular structure of wood and its contaminants. By analyzing how light interacts with chemical bonds, HSI can:
- Identify Species: Detect different wood species based on their distinct lignin and hemicellulose profiles.
- Spot Surface Coatings: Detect surface coatings, such as the distinct absorption peaks of melamine.
- Reveal Resins: Identify chemical resins (PF vs. UF) hiding inside the wood matrix.
3. Classification Pipelines: Per Pixel vs. Per Sample
To translate the 3D hypercube into classification decisions, two distinct deep learning inference pipelines were developed and compared. It worth pointing out that we emphasise the differences in the inference pipelines (test), while the training and validation pipelines remain identical in both cases: training and validation were always done on a Per Pixel basis.
3.1 Pipeline A: Per Pixel Inference
In the Per Pixel pipeline, every spatial coordinate in the hypercube is classified independently based solely on its individual spectral vector. The system performs inference line-by-line in real time as the line-scan HSI camera captures data over the conveyor belt.
3.2 Pipeline B: Per Sample Inference
The Per Sample pipeline groups pixels into discrete physical objects before making a classification decision. This is executed via a three-step sequence:
- Spatial Segmentation: The 2D spatial frame is processed through a segmentation model to generate bounding masks around each individual piece of wood.
- Spectral Averaging: All HSI pixels inside a segmented mask are extracted and averaged into a single representative spectrum.
- Deep Learning Inference: The classification model operates on this single, averaged high-dimensional vector.
4. Experimental Evaluation: Scenarios & Accuracies
The classification performances of the Per Pixel and Per Sample pipelines were evaluated across three operational scenarios of increasing environmental complexity as described in Table 1. More details about the samples can be found in [7]. As mentioned earlier, because training and validation were always carried on a Per Pixel basis, we do not report validation accuracy for the Per Sample inference pipeline in Table 1.
| Scenario | Description | Inference Pipeline | Validation Accuracy (%) | Test Accuracy (%) |
|---|---|---|---|---|
| Clean Sample | Clean, new composite samples in a controlled laboratory environment. | Per Pixel | 99.9 | 99.8 |
| Per Sample | — | 100.0 | ||
| Landfilled Samples | Wood waste retrieved from the Vancouver Landfill, placed individually on a conveyor belt. | Per Pixel | 91.6 | 85.5 |
| Per Sample | — | 91.2 | ||
| Landfilled Stream | Wood waste retrieved from the Vancouver Landfill, mixed together on a conveyor belt. | Per Pixel | 94.5 | 82.0 |
| Per Sample | — | 83.3 |
Two critical conclusions can be drawn from these evaluation results:
4.1 Scenario Complexity vs. Accuracy
As expected, model accuracy decreases as physical complexity increases. Under clean laboratory conditions, the deep learning model performed flawlessly, achieving 99.8% and 100% accuracy on the test sets.
When transitioning to real wood waste pulled directly from the landfill, test accuracies dropped to the 85.5% - 91.1% range. This drop is due to weathered surfaces: some melamine-coated boards were missing chunks of their coating, while others were stained with dirt or mud. An example of false RGB image along with per pixel and per sample classification results obtained for the "Landfilled Samples" scenario is shown in Figure 1.
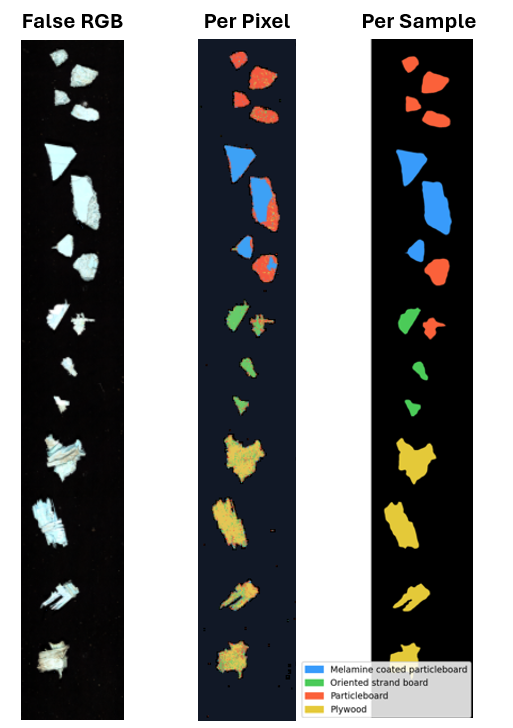
Figure 1: Per Pixel and Per Sample inference comparison based a hyperspectral image of the Landfilled Samples scenario.
The final "Landfilled Stream" scenario mimicked an active recycling facility, introducing spectral mixing, a phenomenon where light bounces off neighboring wood pieces and blends into the target's spectral reading. Despite physical overlapping and spectral mixing, the models still achieved a highly encouraging 82% to 83.3% test accuracy.
4.2 The Per Pixel vs. Per Sample Pipeline Trade-Off
The Per Sample pipeline consistently yielded higher test accuracies (up to a 5.7% improvement in the Landfilled Samples scenario). This superior performance is driven by two factors:
- Higher Signal-to-Noise Ratio (SNR): Averaging the spectra across an entire segmented sample smooths out random sensor noise.
- Spectral Dilution: Weathered wood waste often has minor, localized defects (e.g., small dirt stains or cracks in a melamine face). By averaging the spectra over the entire segmented surface, these localized anomalies are chemically diluted by the dominant surface chemistry of the sample. This "washes out" localized noise to provide a general spectrum that is more representative of the material (Figure 1).
However, this gain in accuracy comes with industrial trade-offs:
- Loss of Fine-Grained Information: Per Pixel inference can tell a manufacturer exactly what percentage of a decorative melamine board is still covered in melamine versus how much is reduced to bare particleboard. Per Sample averaging loses this detailed surface-area mapping (Figure 1).
- Processing Latency: Per Pixel inference is highly efficient; it can run in real time on a line-by-line stream from a line-scan hyperspectral camera. Conversely, segmentation driven Per Sample inference is more computationally intensive. Because segmentation requires a complete 2D image rather than a single line scan, a delay (potentially of a few seconds) is introduced to acquire and process the image, making it a near-real-time workflow.
5. Metaspectral's Clarity Platform: Powering the In-Line Sorting of Tomorrow
Deploying these classification systems within an active, profitable, high-speed industrial production environment requires massive processing power. Hyperspectral images are exceptionally large data packets. Processing these hypercubes on a fast-moving conveyor belt in real time is a significant computational challenge.
This is where Metaspectral's Clarity platform comes in. Clarity is a state-of-the-art, cloud-based platform designed specifically to process hyperspectral images using deep learning. By combining the physical chemistry of near-infrared light with fast neural networks, Metaspectral's technology can:
- Analyze complex chemical matrices on the fly, instantly distinguishing clean structural fiber from reclaimed timber containing chemicals.
- Identify specific composite types, segregating incompatible binders (like UF particleboard).
- Overcome industrial noise, automatically accounting for variables like conveyor belt speed and moisture variations.
Scope a material test with real samples.
Bring us the material classes, contaminants, and operating conditions you need to separate.
References
[1] "Guide for Identifying, Evaluating and Selecting Policies for Influencing Construction, Renovation and Demolition Waste Management," Canadian Council of Ministers of the Environment, 2019.
[2] "Construction and Demolition - Waste Reduction and Recycling Toolkit," Metro Vancouver Regional District, Burnaby, BC, 2023.
[3] "2022 Construction & Demolition Waste Composition Study," Dillon Consulting Limited, Metro Vancouver, 2023.
[4] "2022 Full-Scale Waste Composition Study Report," Dillon Consulting Limited, Metro Vancouver, 2023.
[5] "Our Nature. Our Power. Our Future: CleanBC Plan," Government of British Columbia, Highlights Report, 2018.
[6] "Canadian Council of Ministers of the Environment." Accessed: May 29, 2026. [Online]. Available: https://ccme.ca/en/current-activities/waste
[7] A. Schild, "Sensor-based sorting of waste wood composites and the use of composite particles in cement-bonded wood composites," Doctoral dissertation, University of British Columbia, Vancouver, BC, Canada, 2024.
Related Resources
More product thinking and reference material from the Metaspectral team.
Turning One Reference Spectrum Into Full-Scene Target Detection
See how a CNN-based single-spectrum detector trained on Clarity outperformed classical baselines on full-scene MUUFL target detection across multiple train-test scene pairs.
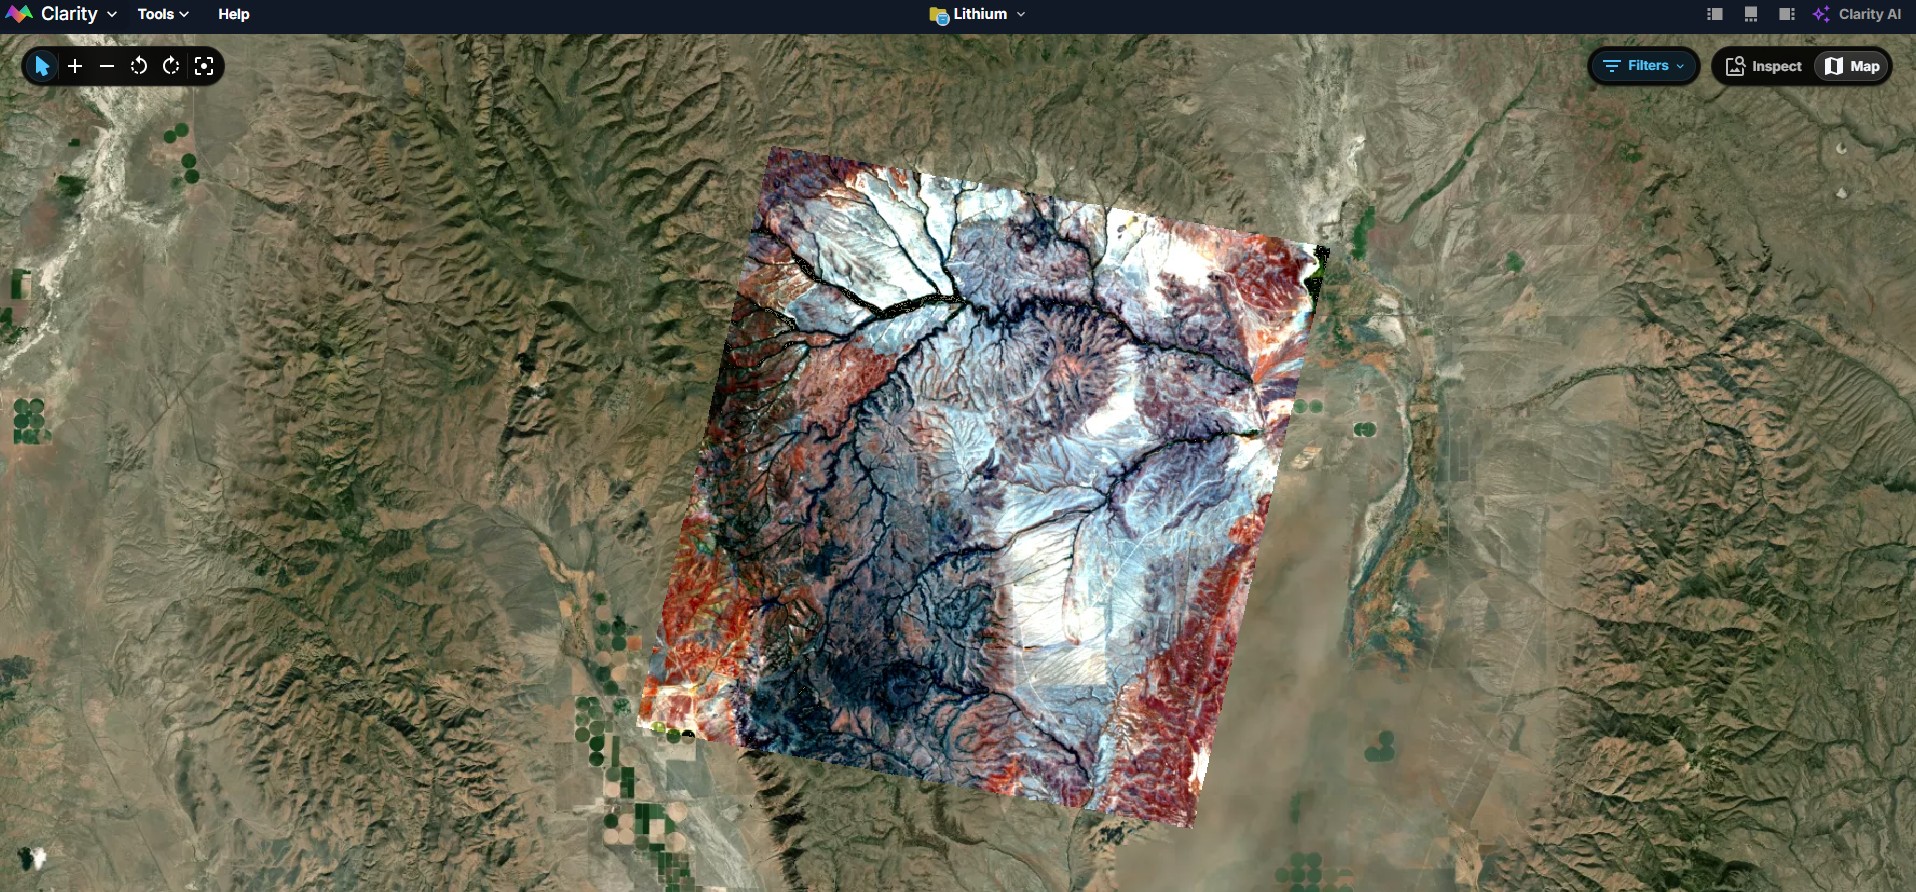
Lithium Detection over the McDermitt Deposit Using Metaspectral’s Clarity Platform
Lithium detection pipeline at the McDermitt deposit using EnMAP hyperspectral data and Metaspectral’s Clarity analysis platform.
How AI Workflows Make Hyperspectral Analysis Repeatable
Hyperspectral teams do not just need faster answers. They need a way to preserve analyst judgment, encode review logic, and apply the right process consistently across scenes, sensors, and operators. That is where workflow-based AI changes the equation.