Clarity Plume™ Matches Metered Methane — Review It Faster, on Your Site
A controlled-release evaluation of Clarity Plume's production methane retrievals against PRISMA and EMIT, with metered releases, no-release periods, and review references beside the result.

Ahmed Sigiuk
Senior Deep Learning Engineer
A plume on a map is not a decision. Operators need a rate they can stand behind, on a site they chose, with something independent next to it.
That is what Clarity Plume is built for, and that is what this test shows: production retrievals against public meters, with the meter and published plumes already beside the result — the same view you get on a live site.
We evaluated Clarity Plume's production methane retrievals against public controlled-release data from Arizona, Evanston, Casa Grande, and Petrolia. The benchmark includes PRISMA and EMIT overpasses with metered releases, known no-release periods, successful detections, and misses.
Bottom line
- Detected rates track the meter. Median absolute error is 46% for PRISMA and 27% for EMIT.
- Review is built in. Clarity Plume automatically retrieves external references beside the satellite result — a controlled-release meter when the site has one, and a Carbon Mapper published plume when they have released a detection for that overpass.
Dataset and evaluation
We used public controlled-release measurements published by Stanford for Arizona, Evanston, and Casa Grande, and a FluxLab SIMFLEX metered release at Petrolia, Ontario. The benchmark covers Arizona in 2021, Evanston in 2024, Casa Grande in 2024–25, and Petrolia in 2025. All PRISMA and EMIT archive overpasses available for those campaigns at the evaluation freeze are retained, including scenes where Clarity Plume did not detect the metered release. Six additional Casa Grande PRISMA overpasses and one Petrolia PRISMA overpass are included.
| Site | Period | Sensor | Metered releases | Certified no-release |
|---|---|---|---|---|
| Arizona | 2021 | PRISMA | 3 | — |
| Evanston | 2024 | PRISMA | 2 | — |
| Petrolia | 2025 | PRISMA | 1 | — |
| Casa Grande | 2024–25 | PRISMA | 19 | 3 |
| Casa Grande | 2024–25 | EMIT | 8 | 2 |
Table 1. Controlled-release evaluation dataset by site and sensor.
A satellite result is paired with a meter reading taken within one hour of the overpass. A positive Clarity Plume emission rate counts as a detection. Missed releases remain in the detection denominator and are plotted at zero in the rate comparison.
Quantification gain was fitted once using the scenes marked fit. Scenes marked holdout were not re-fitted after evaluation. False alarms are scored only where the campaign record confirms that the meter was off and the no-release period passes quality control. Archive dates without a usable meter are not counted as true negatives.
Results
Figure 1 compares Clarity Plume's reported rates with the ground meters. The grey band marks estimates within ±30% of the metered rate. Detected PRISMA and EMIT scenes cluster around the one-to-one line, but the points at zero show that some substantial releases were missed.
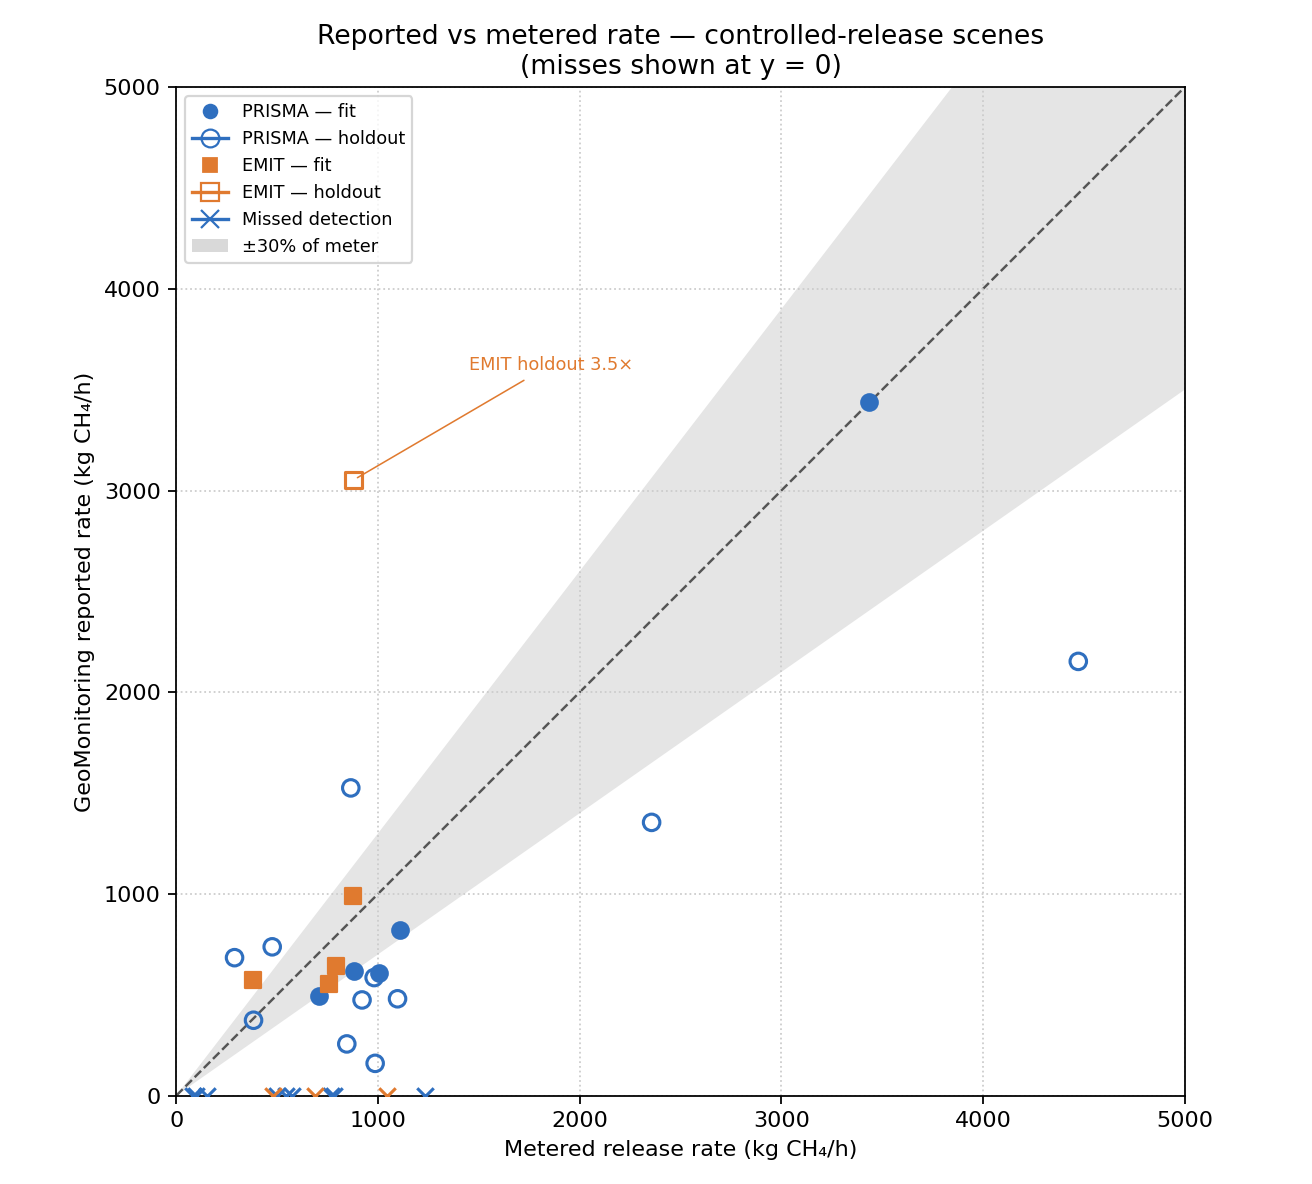
Figure 1. Reported rate versus metered release rate for PRISMA and EMIT. Missed detections are plotted at zero; fit and holdout scenes are marked separately.
| Metric | PRISMA | EMIT |
|---|---|---|
| Metered releases detected | 16/25 (64%) | 5/8 (63%) |
| False alarms on certified no-release overpasses | 0/3 | 0/2 |
| Geometric-mean reported/metered rate, detections | 0.69× | 1.28× |
| Median absolute percent error, detections | 46% | 27% |
| Smallest detected release in this dataset | 289 kg/h | 382 kg/h |
Table 2. Summary of controlled-release performance. The smallest detected release is a dataset observation, not a minimum detection limit.
Every retained PRISMA and EMIT overpass is listed at the end of this post.
Clarity Plume application
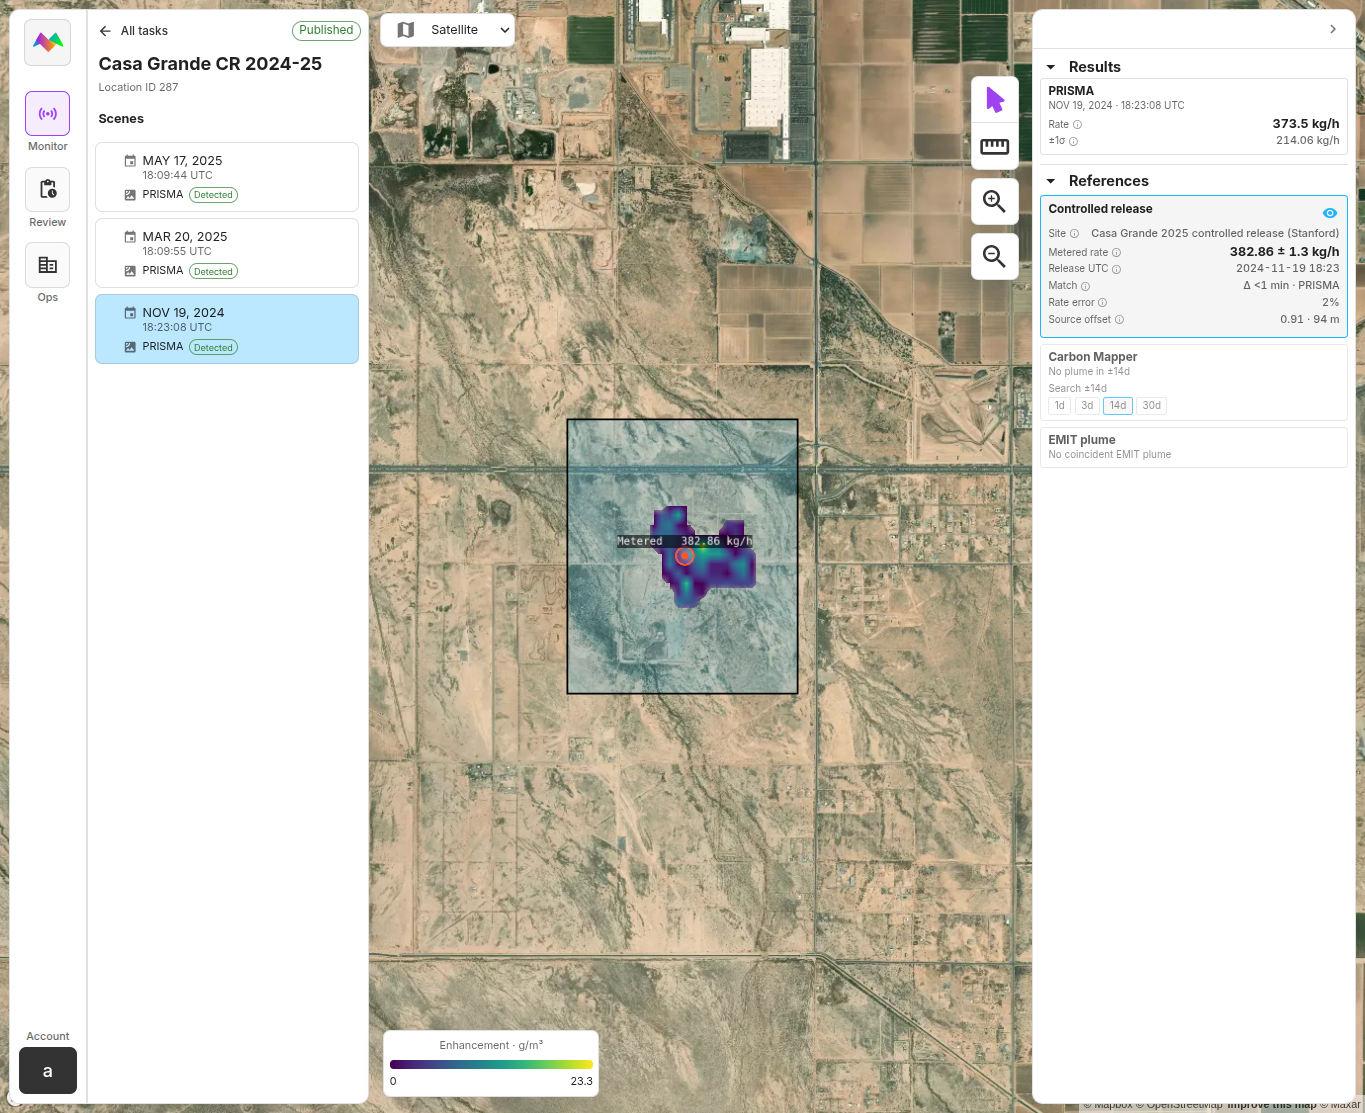
The same Casa Grande overpasses appear in Clarity Plume with the retrieved plume, the meter, and the reported rate. Table 5 lists rate error, ±1σ, and source offset for the four scenes in Figures 2–5.
| Sensor | Date (UTC) | Metered (kg/h) | Reported (kg/h) | ±1σ (kg/h) | Rate error | Source offset |
|---|---|---|---|---|---|---|
| PRISMA | 2025-06-15 | 1,004.7 | 606.8 | 234 | 40% | 162 m |
| EMIT | 2025-06-23 | 879.2 | 3,053.1 | 4,697 | 247% | 218 m |
| PRISMA | 2025-11-25 | 880.7 | 618.3 | 208 | 30% | 196 m |
| EMIT | 2025-11-29 | 382.4 | 574.3 | 693 | 50% | 156 m |
Table 5. Workbench metrics for the four Casa Grande scenes. Source offset is the distance from the retrieved source to the release point.
June includes a PRISMA result and the EMIT holdout outlier from Table 4.
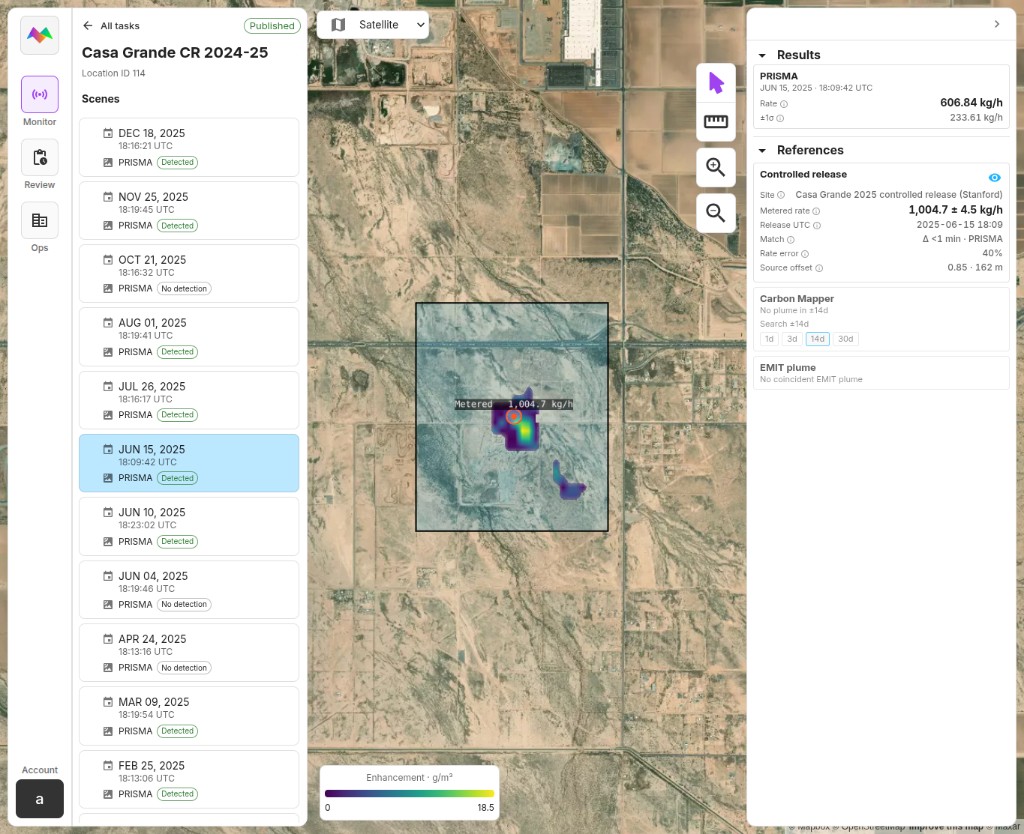
Figure 2. PRISMA, 15 June 2025. The reported rate is 40% below the meter. ±1σ (234 kg/h) is smaller than the rate, and the source is 162 m from the release point.
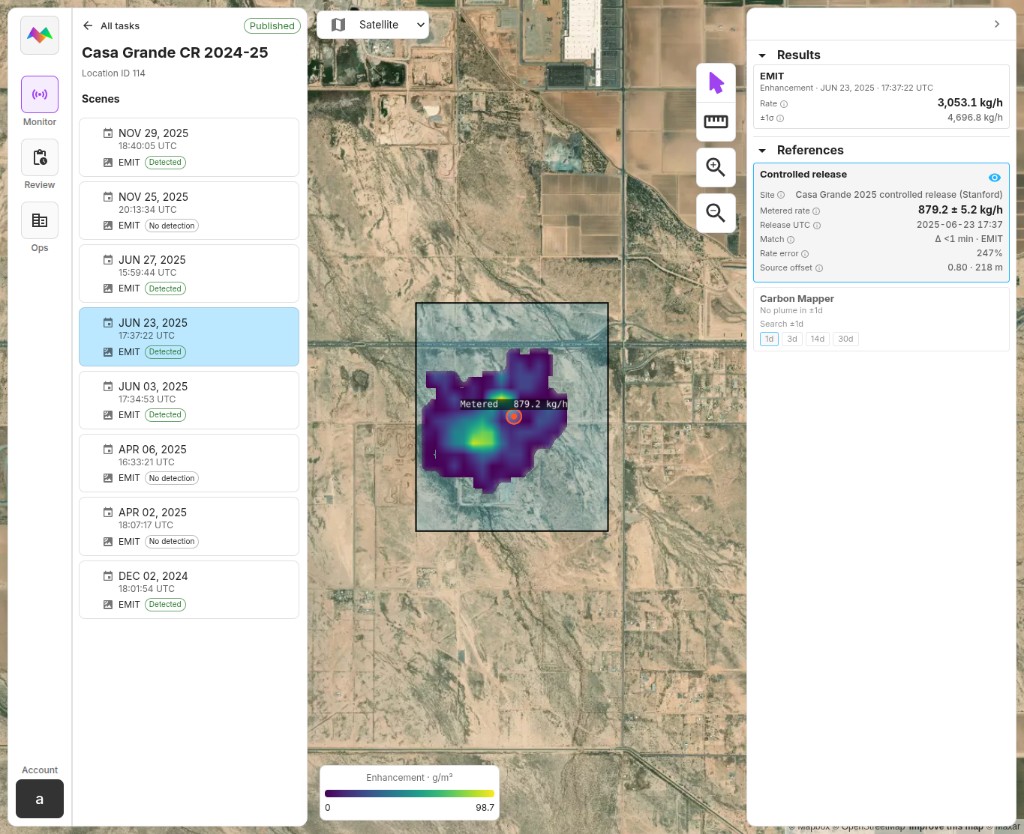
Figure 3. EMIT, 23 June 2025. The plume is in the right place (218 m offset), but the rate is 247% high and ±1σ (4,697 kg/h) is larger than the estimate, so the quantification is unstable.
November covers smaller releases.

Figure 4. PRISMA, 25 November 2025. A smaller release: 30% below the meter, with ±1σ comparable to the reported rate and a 196 m offset.

Figure 5. EMIT, 29 November 2025. Smallest EMIT detection in this dataset. The rate is 50% high; ±1σ again exceeds the estimate, while the source offset is the tightest of the four (156 m).
Discussion
The point of this check is not only that detected rates sit close to the meter. It is that a reviewer can see that comparison in Clarity Plume, next to the plume, the rate, and the uncertainty — instead of treating the retrieval as an unsupported alert.
On a controlled-release site, Clarity Plume puts the campaign meter beside our rate so the same overpass can be checked against ground truth. Where Carbon Mapper has published a plume for that scene, that map is pulled in automatically. The reviewer is not assembling those sources; they are already next to the retrieval.
The same layout is what we are extending. More metered CR sites will attach as campaigns publish. EnMAP and limited PRISMA tasking will use the same review, as will commercial satellites such as Tanager and others — archive scenes and tasked acquisitions checked the same way, with the meter and published plumes still in view when they exist.
The present dataset remains small, particularly for false-alarm evaluation. These results demonstrate the workflow and its current performance, but additional campaigns are needed to characterize reliability across a wider range of conditions.
Scene-by-scene results
The tables below list every retained overpass in this benchmark. Use them to check a date, a miss, or a holdout without re-reading the summary.
PRISMA
PRISMA gives the larger sample in this benchmark. Its median detected-scene error is 46%, and its geometric-mean estimate is 31% below the meter. The holdout-only geometric mean is 0.67×, showing similar average behavior on scenes that were not used to fit the gain.
Detection remains the main limitation. PRISMA misses nine metered releases, including releases of 1,232 kg/h, 767 kg/h, and 572 kg/h at Petrolia, so source magnitude alone does not explain whether a plume is found. It reports no positive rate on the three certified no-release overpasses. Three no-release scenes are too few to estimate a stable false-alarm rate, but the observed outcomes are included in full below.
| Site | Date (UTC) | Cloud (%) | Outcome | Split | Meter (kg/h) | Reported (kg/h) | Reported/metered |
|---|---|---|---|---|---|---|---|
| Arizona 2021 | 2021-10-16 18:36 | 0.3 | Detection | Holdout | 2,357 | 1,354.7 | 0.575 |
| Arizona 2021 | 2021-10-21 18:23 | 0.5 | Detection | Holdout | 4,473 | 2,153.1 | 0.481 |
| Arizona 2021 | 2021-10-27 18:26 | 0.1 | Detection | Fit | 3,436 | 3,438.4 | 1.001 |
| Evanston | 2024-08-30 18:24 | 0.0 | Miss | — | 767.2 | 0 | — |
| Evanston | 2024-09-05 18:27 | 0.0 | Miss | — | 1,232 | 0 | — |
| Petrolia | 2025-06-03 16:23 | 0.0 | Miss | — | 571.8 | 0 | — |
| Casa Grande | 2024-11-19 18:23 | 0.3 | Detection | Holdout | 382.9 | 373.5 | 0.975 |
| Casa Grande | 2024-12-23 18:09 | 0.1 | Detection | Holdout | 845.4 | 256.1 | 0.303 |
| Casa Grande | 2024-12-29 18:13 | 0.5 | Detection | Holdout | 1,097 | 479.9 | 0.437 |
| Casa Grande | 2025-01-10 18:19 | 0.4 | True negative | — | 0 | 0 | — |
| Casa Grande | 2025-01-16 18:23 | 0.1 | Miss | — | 781.4 | 0 | — |
| Casa Grande | 2025-01-21 18:09 | 1.3 | Detection | Holdout | 865.2 | 1,525.7 | 1.763 |
| Casa Grande | 2025-02-02 18:16 | 0.1 | Miss | — | 544 | 0 | — |
| Casa Grande | 2025-02-25 18:13 | 0.6 | Detection | Holdout | 921 | 474.2 | 0.515 |
| Casa Grande | 2025-03-09 18:19 | 0.4 | Detection | Fit | 1,107 | 822.0 | 0.743 |
| Casa Grande | 2025-03-20 18:09 | 0.7 | Detection | Holdout | 475.5 | 737.6 | 1.551 |
| Casa Grande | 2025-04-24 18:13 | 0.5 | Miss | — | 500 | 0 | — |
| Casa Grande | 2025-05-17 18:09 | 0.4 | Detection | Holdout | 288.7 | 683.8 | 2.368 |
| Casa Grande | 2025-06-04 18:19 | 1.2 | True negative | — | 0 | 0 | — |
| Casa Grande | 2025-06-10 18:23 | 0.2 | Detection | Holdout | 981 | 585.1 | 0.596 |
| Casa Grande | 2025-06-15 18:09 | 0.1 | Detection | Fit | 1,005 | 606.8 | 0.604 |
| Casa Grande | 2025-07-26 18:16 | 0.3 | No certified meter | — | — | 48.4 | — |
| Casa Grande | 2025-08-01 18:19 | 0.0 | Detection | Fit | 708 | 492.6 | 0.696 |
| Casa Grande | 2025-08-18 18:13 | 0.8 | Miss | — | 99.1 | 0 | — |
| Casa Grande | 2025-10-21 18:16 | 0.5 | True negative | — | 0 | 0 | — |
| Casa Grande | 2025-11-07 18:09 | 0.3 | Miss | — | 80.5 | 0 | — |
| Casa Grande | 2025-11-25 18:19 | 0.5 | Detection | Fit | 881 | 618.3 | 0.702 |
| Casa Grande | 2025-12-12 18:13 | 0.5 | Miss | — | 153.2 | 0 | — |
| Casa Grande | 2025-12-18 18:16 | 1.0 | Detection | Holdout | 986 | 159.7 | 0.162 |
Table 3. PRISMA results for every retained overpass. Cloud % is the cloudy-pixel fraction from the PRISMA L1 Cloud_Mask over the full scene. The July 26 scene has no certified meter and is excluded from both detection and false-alarm totals. The Petrolia overpass is a holdout miss and was not used to fit the quantification gain.
EMIT
EMIT has only eight metered releases in this benchmark, so its results are less settled. It detects five releases, with a median absolute rate error of 27%. The geometric-mean estimate is 28% above the meter, driven partly by a June 23 holdout scene reported at 3.47 times the metered rate.
EMIT misses three releases, including one above 1,000 kg/h. It produces no positive rate on either certified no-release overpass. That is encouraging, but two no-release scenes are not enough to establish a general false-alarm rate.
| Site | Date (UTC) | Cloud (%) | Outcome | Split | Meter (kg/h) | Reported (kg/h) | Reported/metered |
|---|---|---|---|---|---|---|---|
| Casa Grande | 2024-12-02 18:01 | 38 | Detection | Fit | 756 | 550.8 | 0.729 |
| Casa Grande | 2025-04-02 18:07 | 69 | Miss | — | 1,043 | 0 | — |
| Casa Grande | 2025-04-06 16:33 | 25 | Miss | — | 689 | 0 | — |
| Casa Grande | 2025-06-03 17:34 | 8 | Detection | Fit | 794 | 640.7 | 0.807 |
| Casa Grande | 2025-06-23 17:37 | 4 | Detection | Holdout | 879 | 3,053.1 | 3.473 |
| Casa Grande | 2025-06-27 15:59 | 24 | Detection | Fit | 875 | 990.0 | 1.131 |
| Casa Grande | 2025-07-18 23:39 | 60 | True negative | — | 0 | 0 | — |
| Casa Grande | 2025-09-24 20:46 | 14 | True negative | — | 0 | 0 | — |
| Casa Grande | 2025-11-25 20:13 | 23 | Miss | — | 478 | 0 | — |
| Casa Grande | 2025-11-29 18:40 | 33 | Detection | Fit | 382 | 574.3 | 1.503 |
Table 4. EMIT CH4ENH results for every retained overpass. Cloud % is NASA CMR CloudCover on the L1B radiance granule.
Run an EO validation on real imagery and targets.
Tell us about your sensor, region, targets, and ground-truth data so we can map the right validation path.
Related Resources
More product thinking and reference material from the Metaspectral team.
From Spectral Libraries to Cuprite — Better, Faster Alteration Maps
Exploration teams looking for copper, gold, and critical-mineral deposits use hyperspectral imagery to map exposed alteration and indicator minerals—clays, micas, iron oxides, carbonates, and related assemblages.
Seeing beyond the bands
Where hyperspectral analysis diverges from multispectral — and what that divergence reveals about a crop. Measured on real scenes.

Metaspectral Partners with Planet to Deliver Trusted Spectral Intelligence from Tanager Hyperspectral Data
Metaspectral announced its partnership with Planet Labs PBC to deliver trusted, evidence-based spectral intelligence from Planet Tanager™ hyperspectral data through Metaspectral Clarity.