Classification, Regression and Target detection In Fusion.
on Mon Apr 14 2025

Guillaume
Fusion is a cloud based computing platform by Metaspectral specifically designed to handle and process hyperspectral imagery. Fusion operates directly in your browser, storing data on the cloud. This eliminates the need for installation and prevents large images from taking up space on your hard drive. In this post we will look at how to easily build classification, regression and target detection deep learning models in Fusion from scratch. For this, we will use two open-source datasets listed in Table 1. The Grapevine dataset is constituted of 204 hyperspectral images of grapevine leaves. For each leaf, the grapevine variety and chlorophyl content is available. The Blood Stain dataset is constituted of 14 hyperspectral images of stains made from blood, artificial blood, ketchup, beetroot juice, tomato concentrate and paints on various types of materials.
| Dataset | License | Size (GB) | Number of images | Camera | Task |
Grapevine (1) | Etalab Open License 2.0 | 32 | 204 | Specim IQ (400 – 1000 nm) | Classification Regression |
| Blood Stain (2) | CC BY 4.0 | 1.3 | 14 | Surface Optics 710 (380 – 1045 nm) | Target Detection |
Data Upload
The first step is to upload your data to the Fusion Drive, it can’t become much easier then this as it is just a drag and drop operation.
Image Labelling
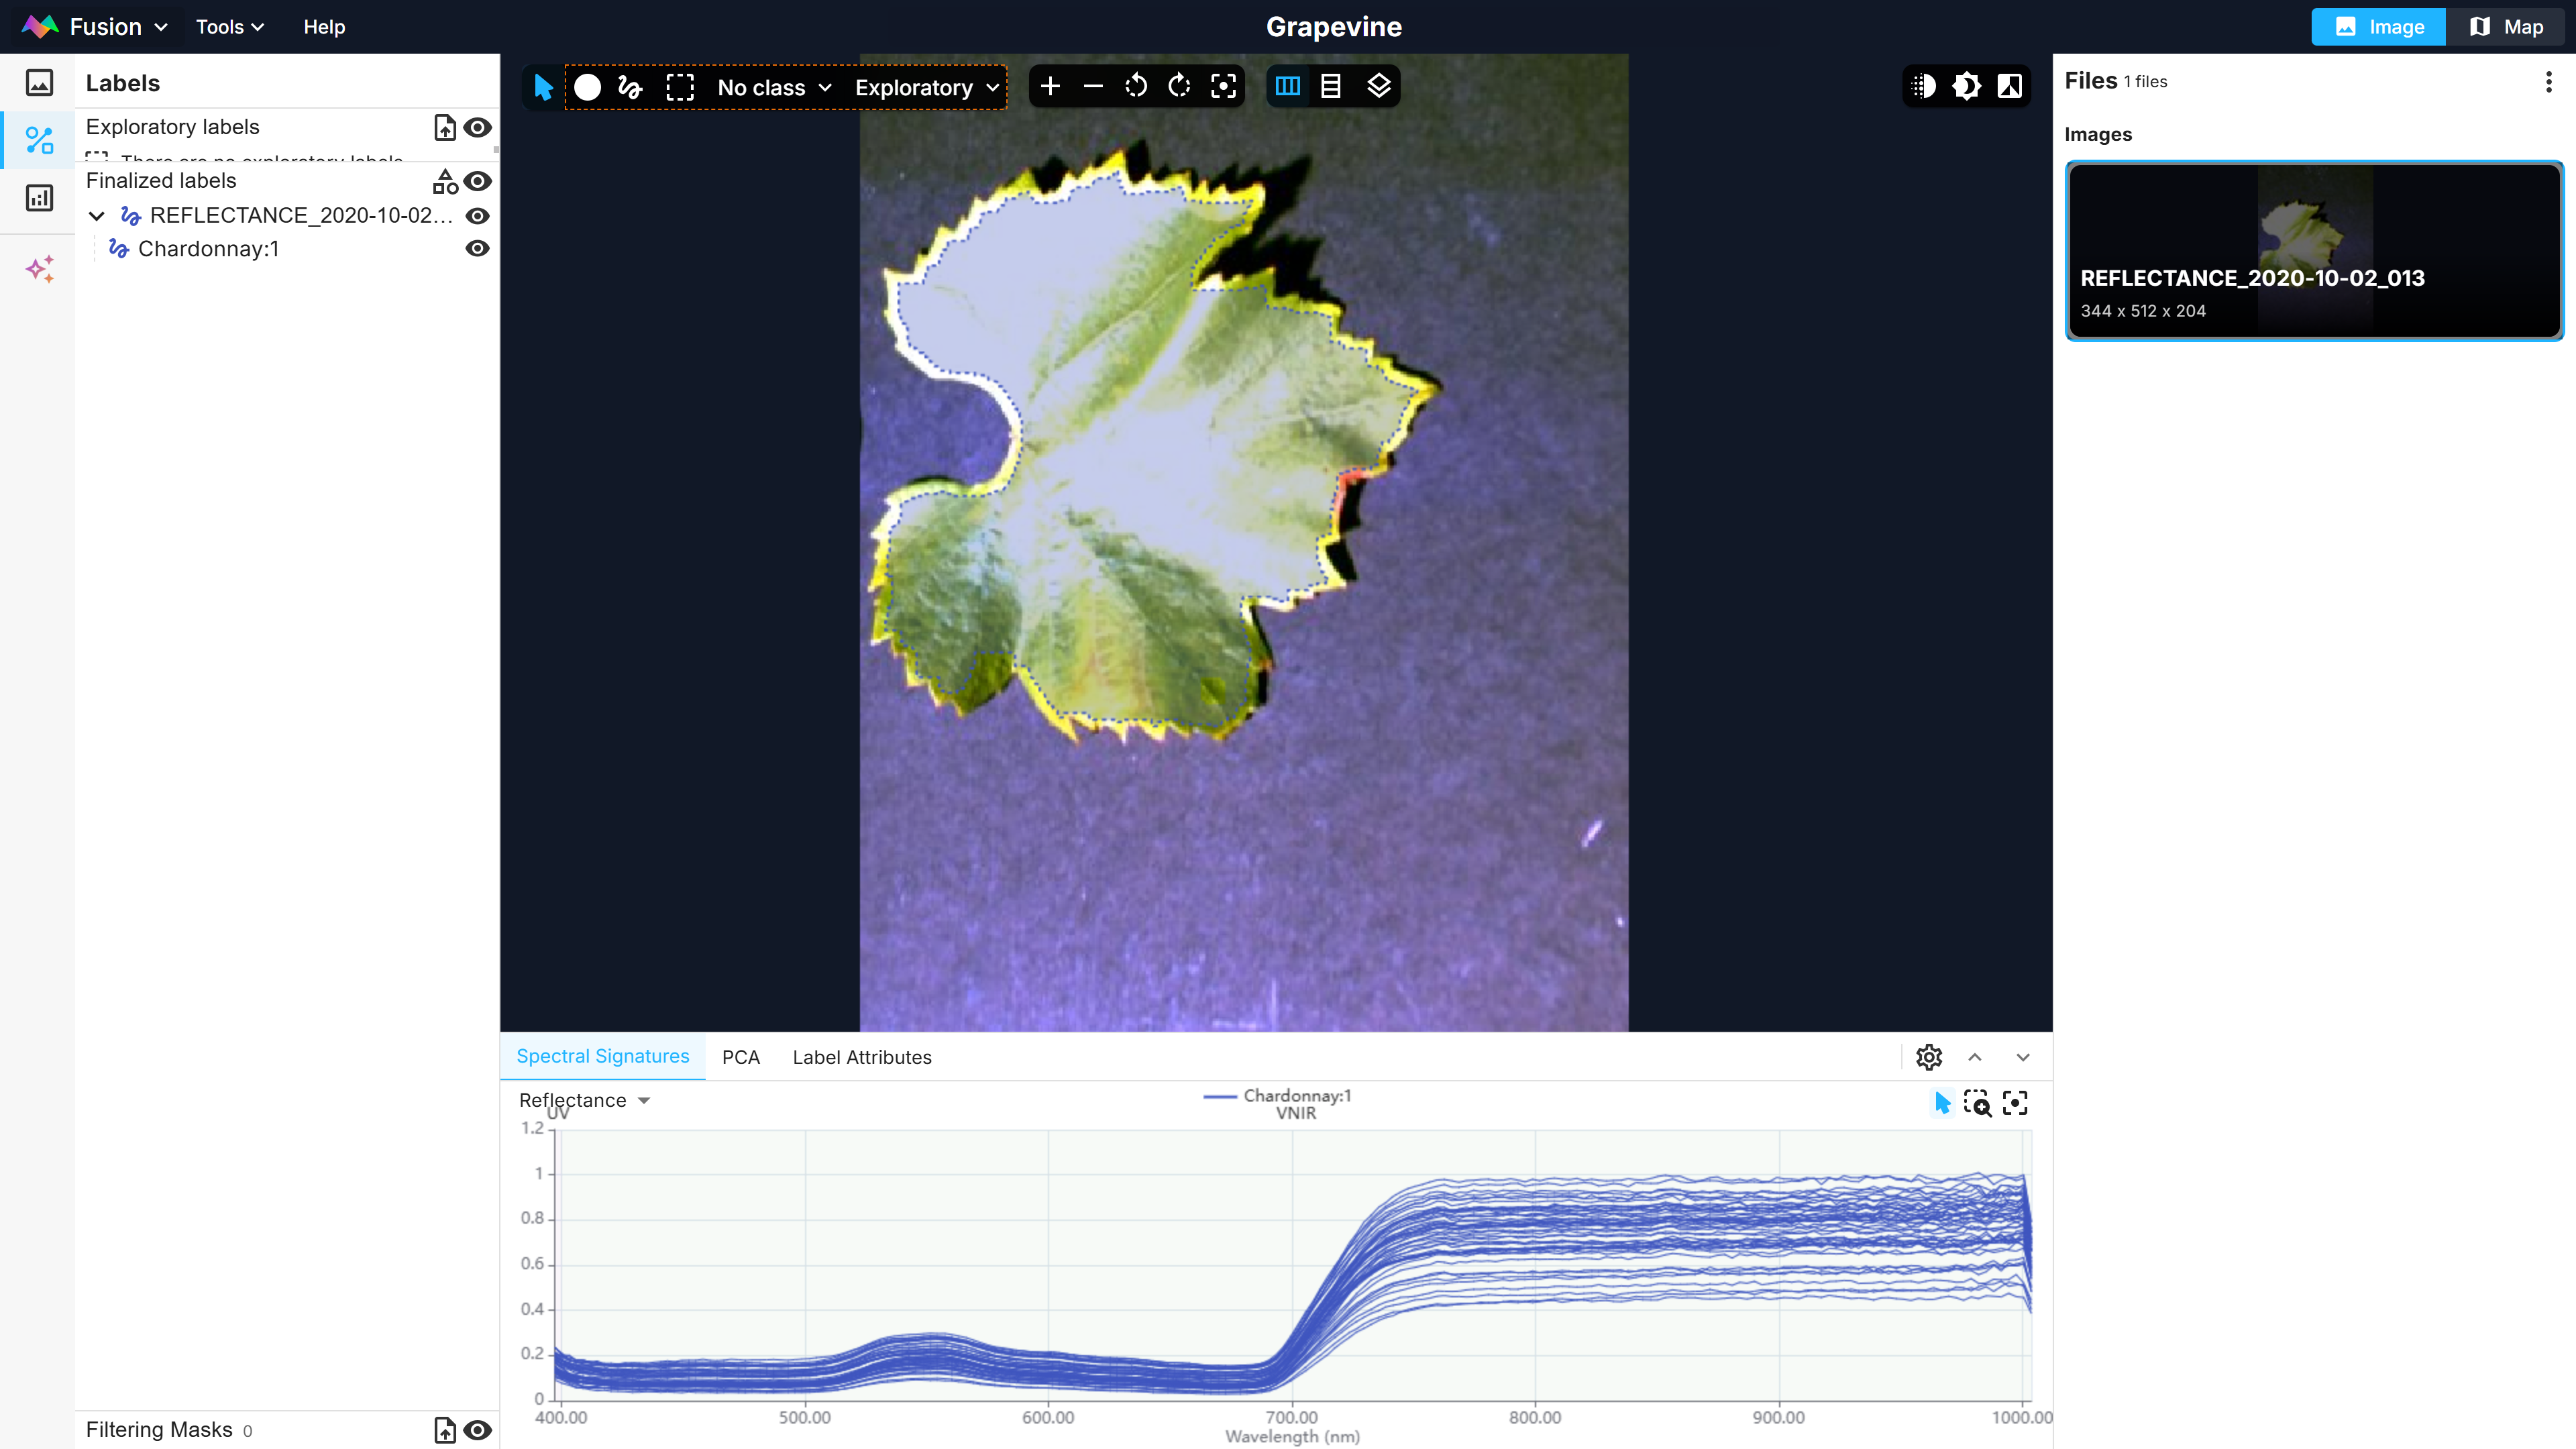
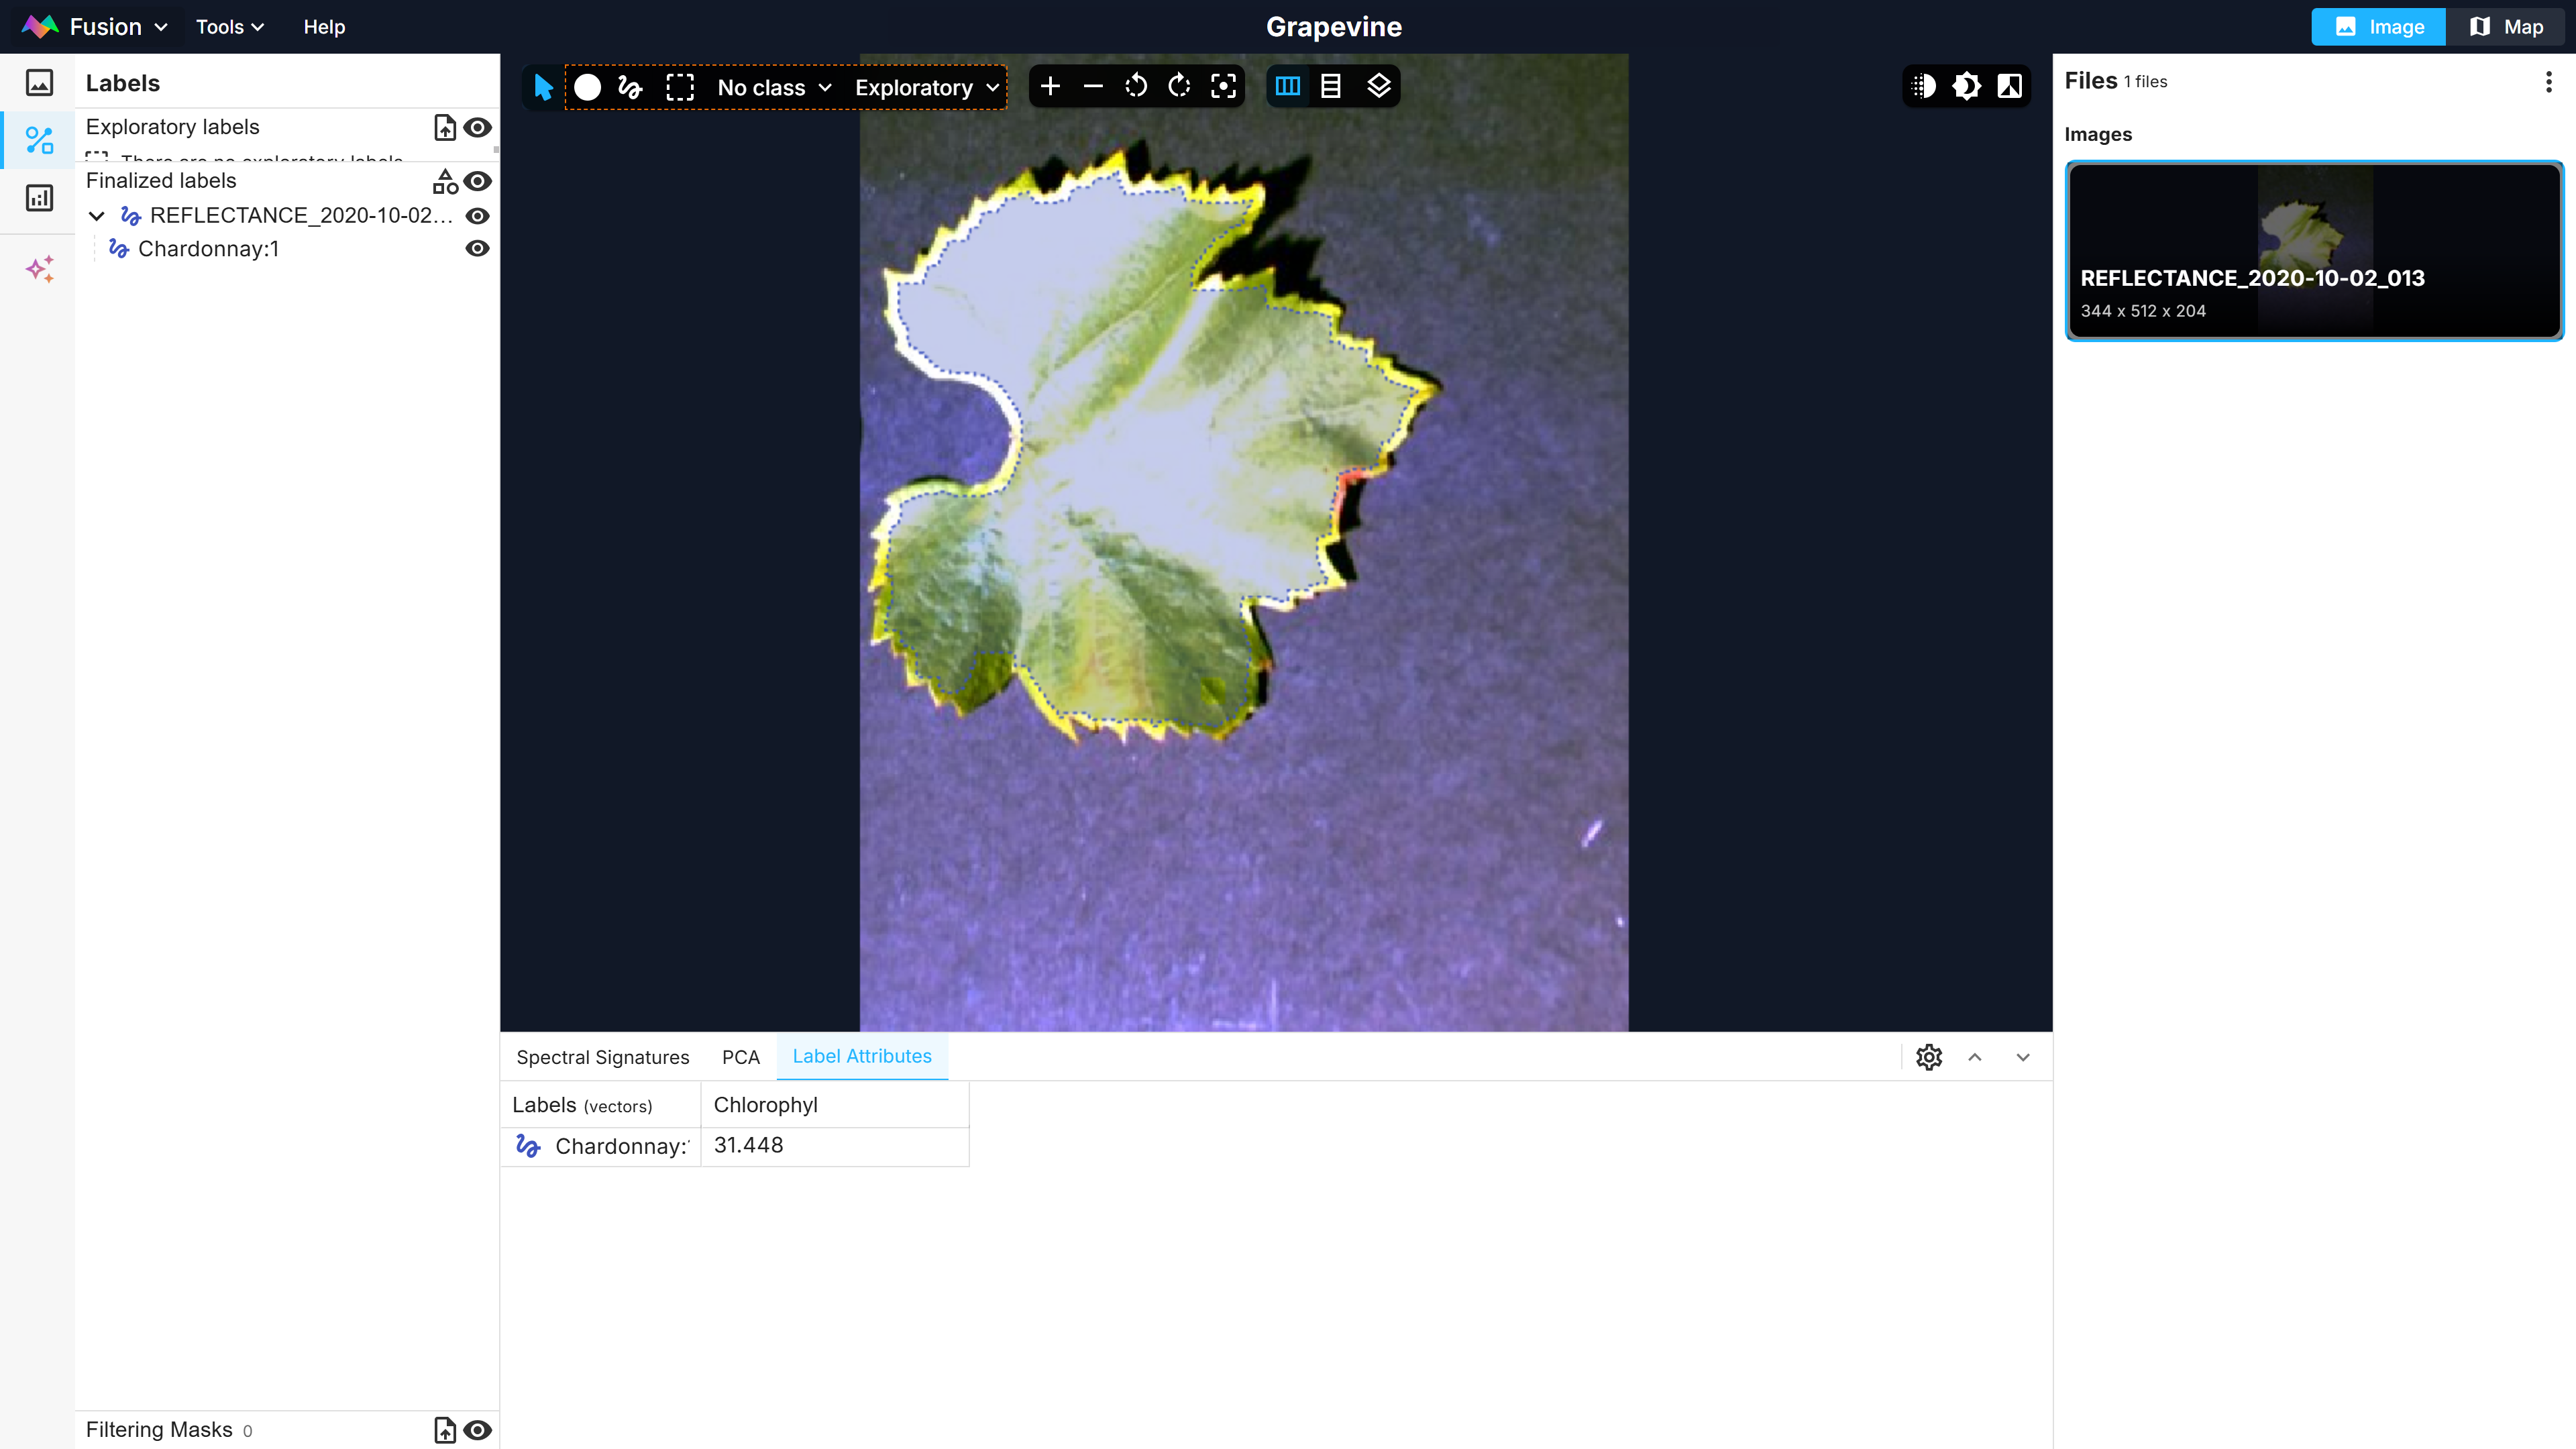
Second, the hyperspectral images need to be labelled in the Fusion Explorer. This can be made by making a selection with the lasso tool on the image or by uploading a shapefile. The spectra corresponding to the pixel selection are shown in the bottom spectral signature tab (Figure 1). Labels can also be assigned attributes in the Label Attributes tab. Here, the Chardonnay label will be assigned the Chlorophyl attribute, representing the chlorophyl content, with a value of 31.448 µg/cm² (Figure 2).
Datasets
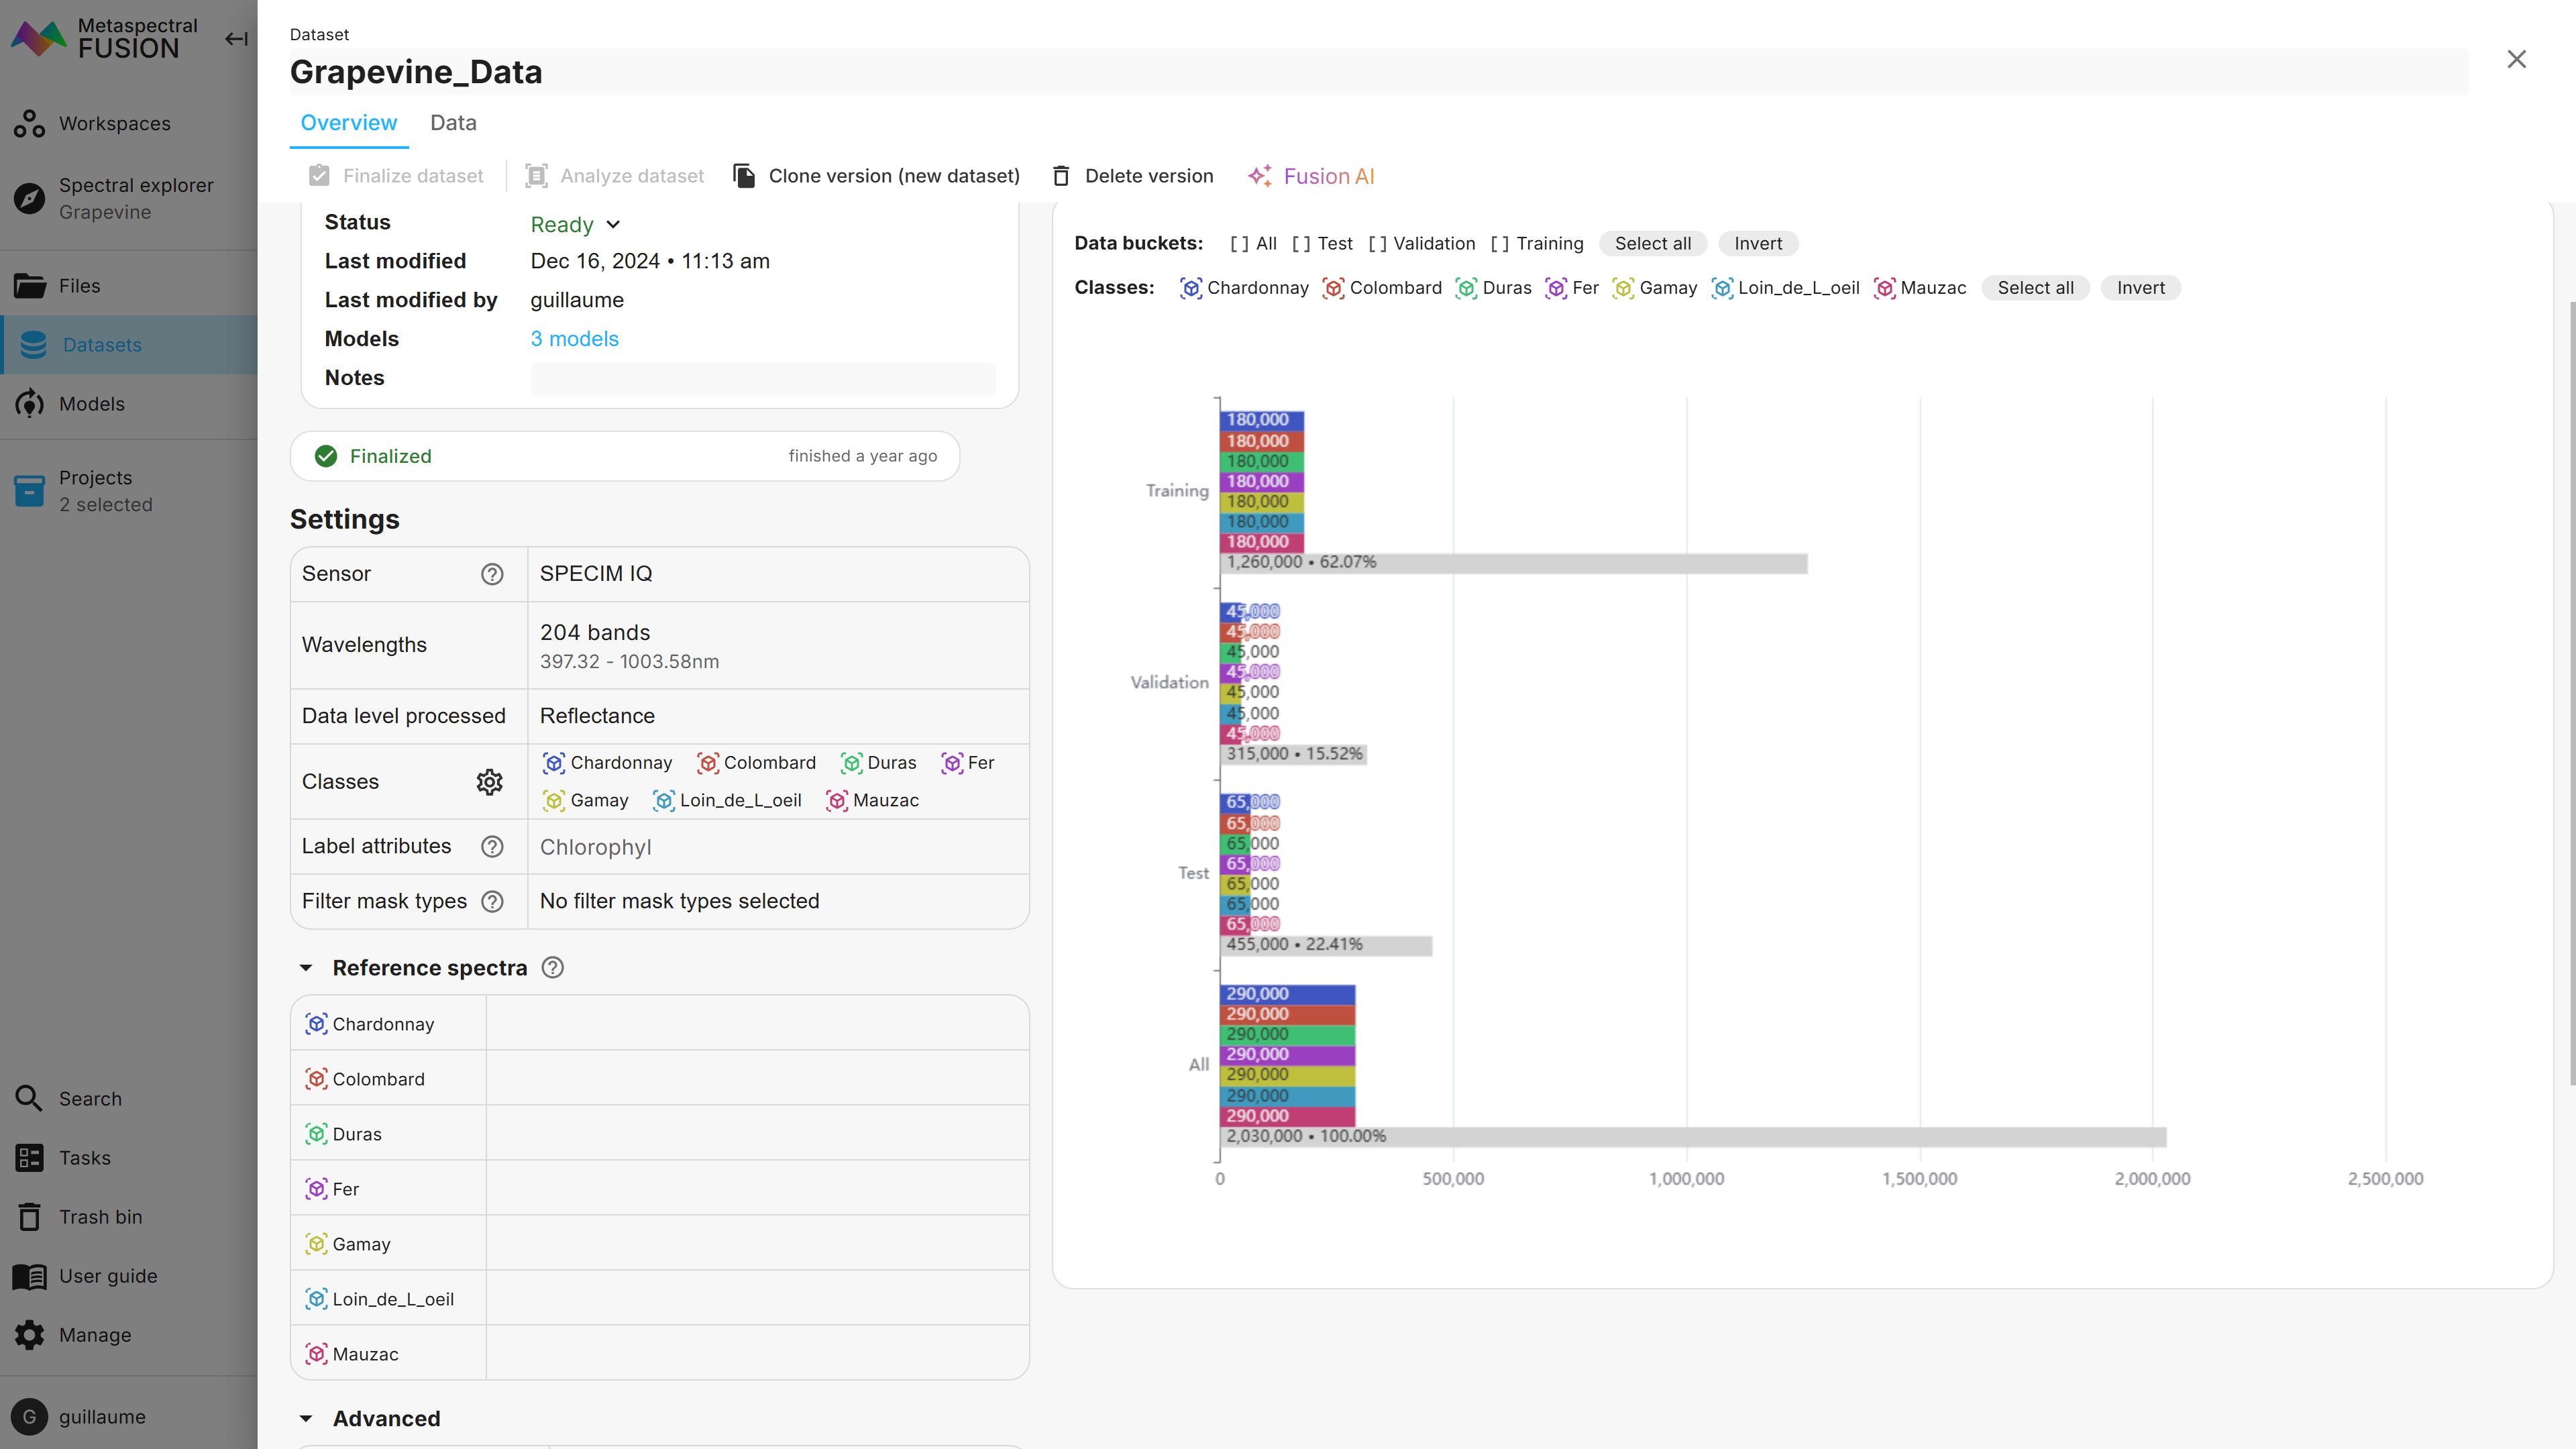
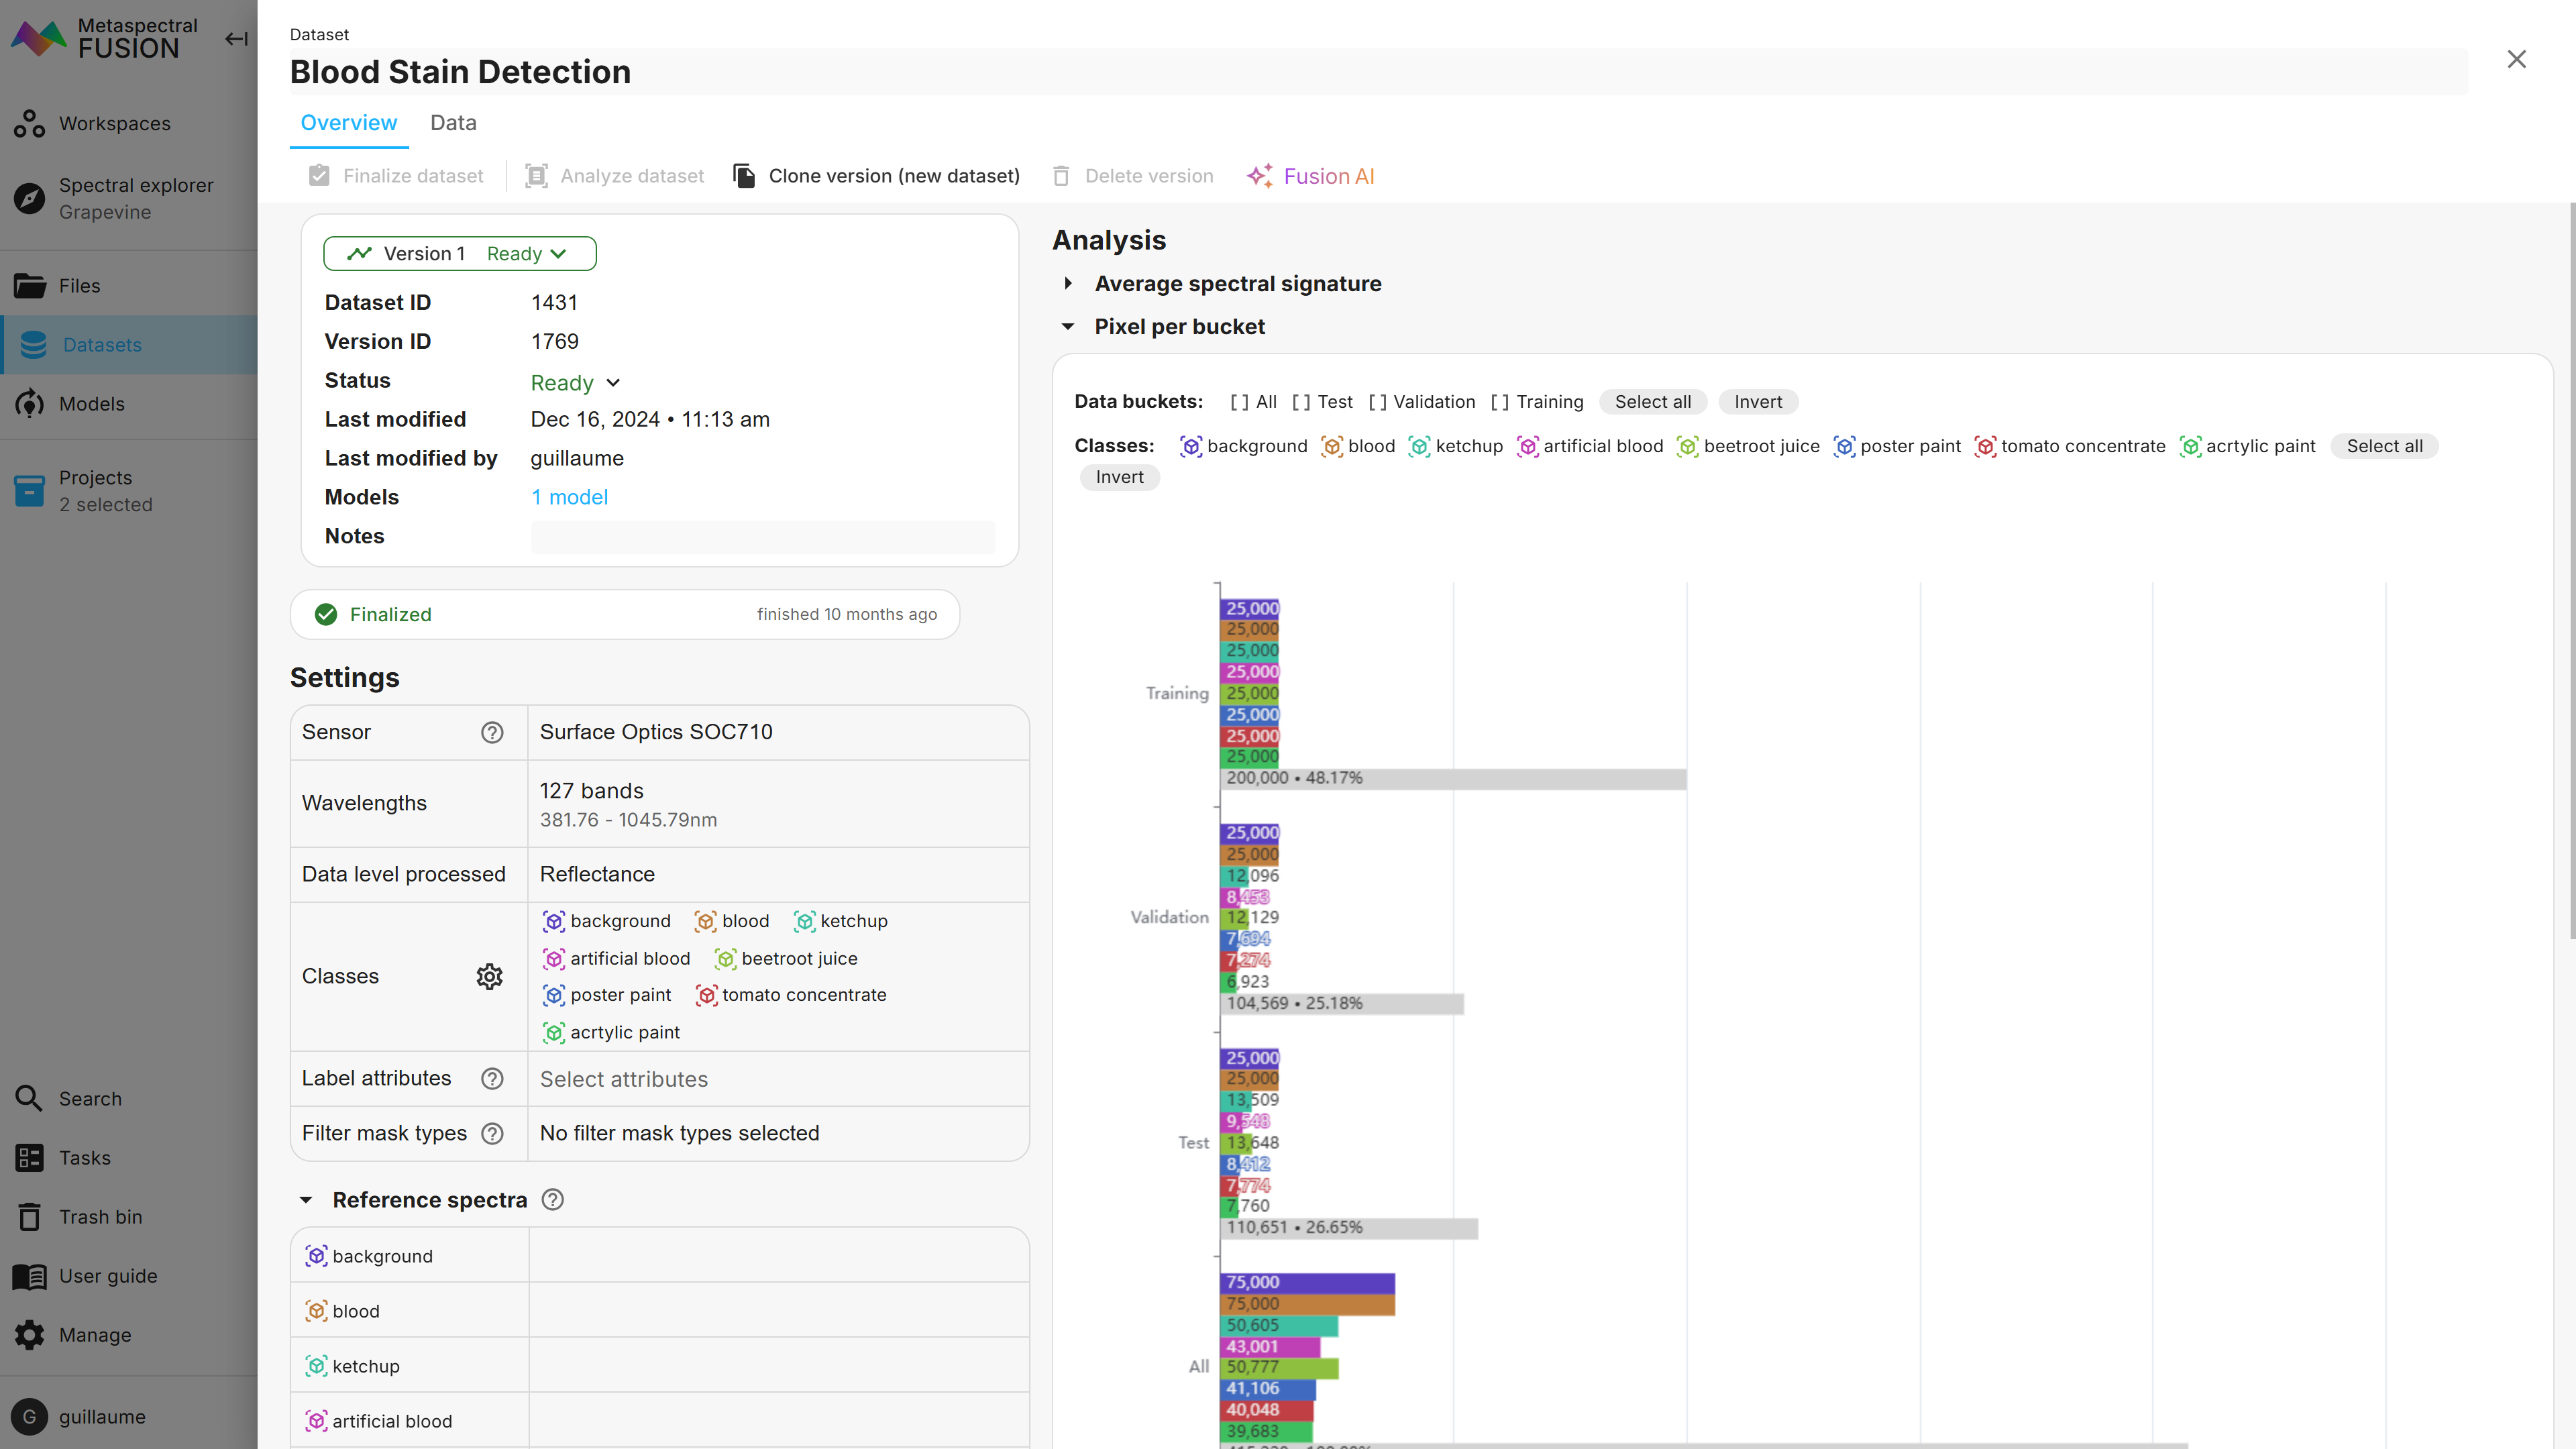
Third, once all images are labelled, datasets are built using the labels of interest and the associated images. The Fusion Dataset overview in Figure 3 shows that, in total 290,000 pixels (i.e. spectra) were selected for each label of the Grapevine data, split among the training, validation and test subsets. These numbers can be adjusted by the user as desired.
For the Blood Stain dataset, 75,000 pixels were selected per label, but because some labels contained less than the desired number, the number of pixels for some labels was adjusted to the maximum available.
Models and Results
The fourth and last step is to develop deep learning models. Fusion Models offer various deep learning architecture, including convolutional and residual networks, transformers and vision transformers which can be leveraged for tasks such as classification, regression, target detection and unmixing. The three formers will be covered herein; unmixing will be covered in a future post.
Classification
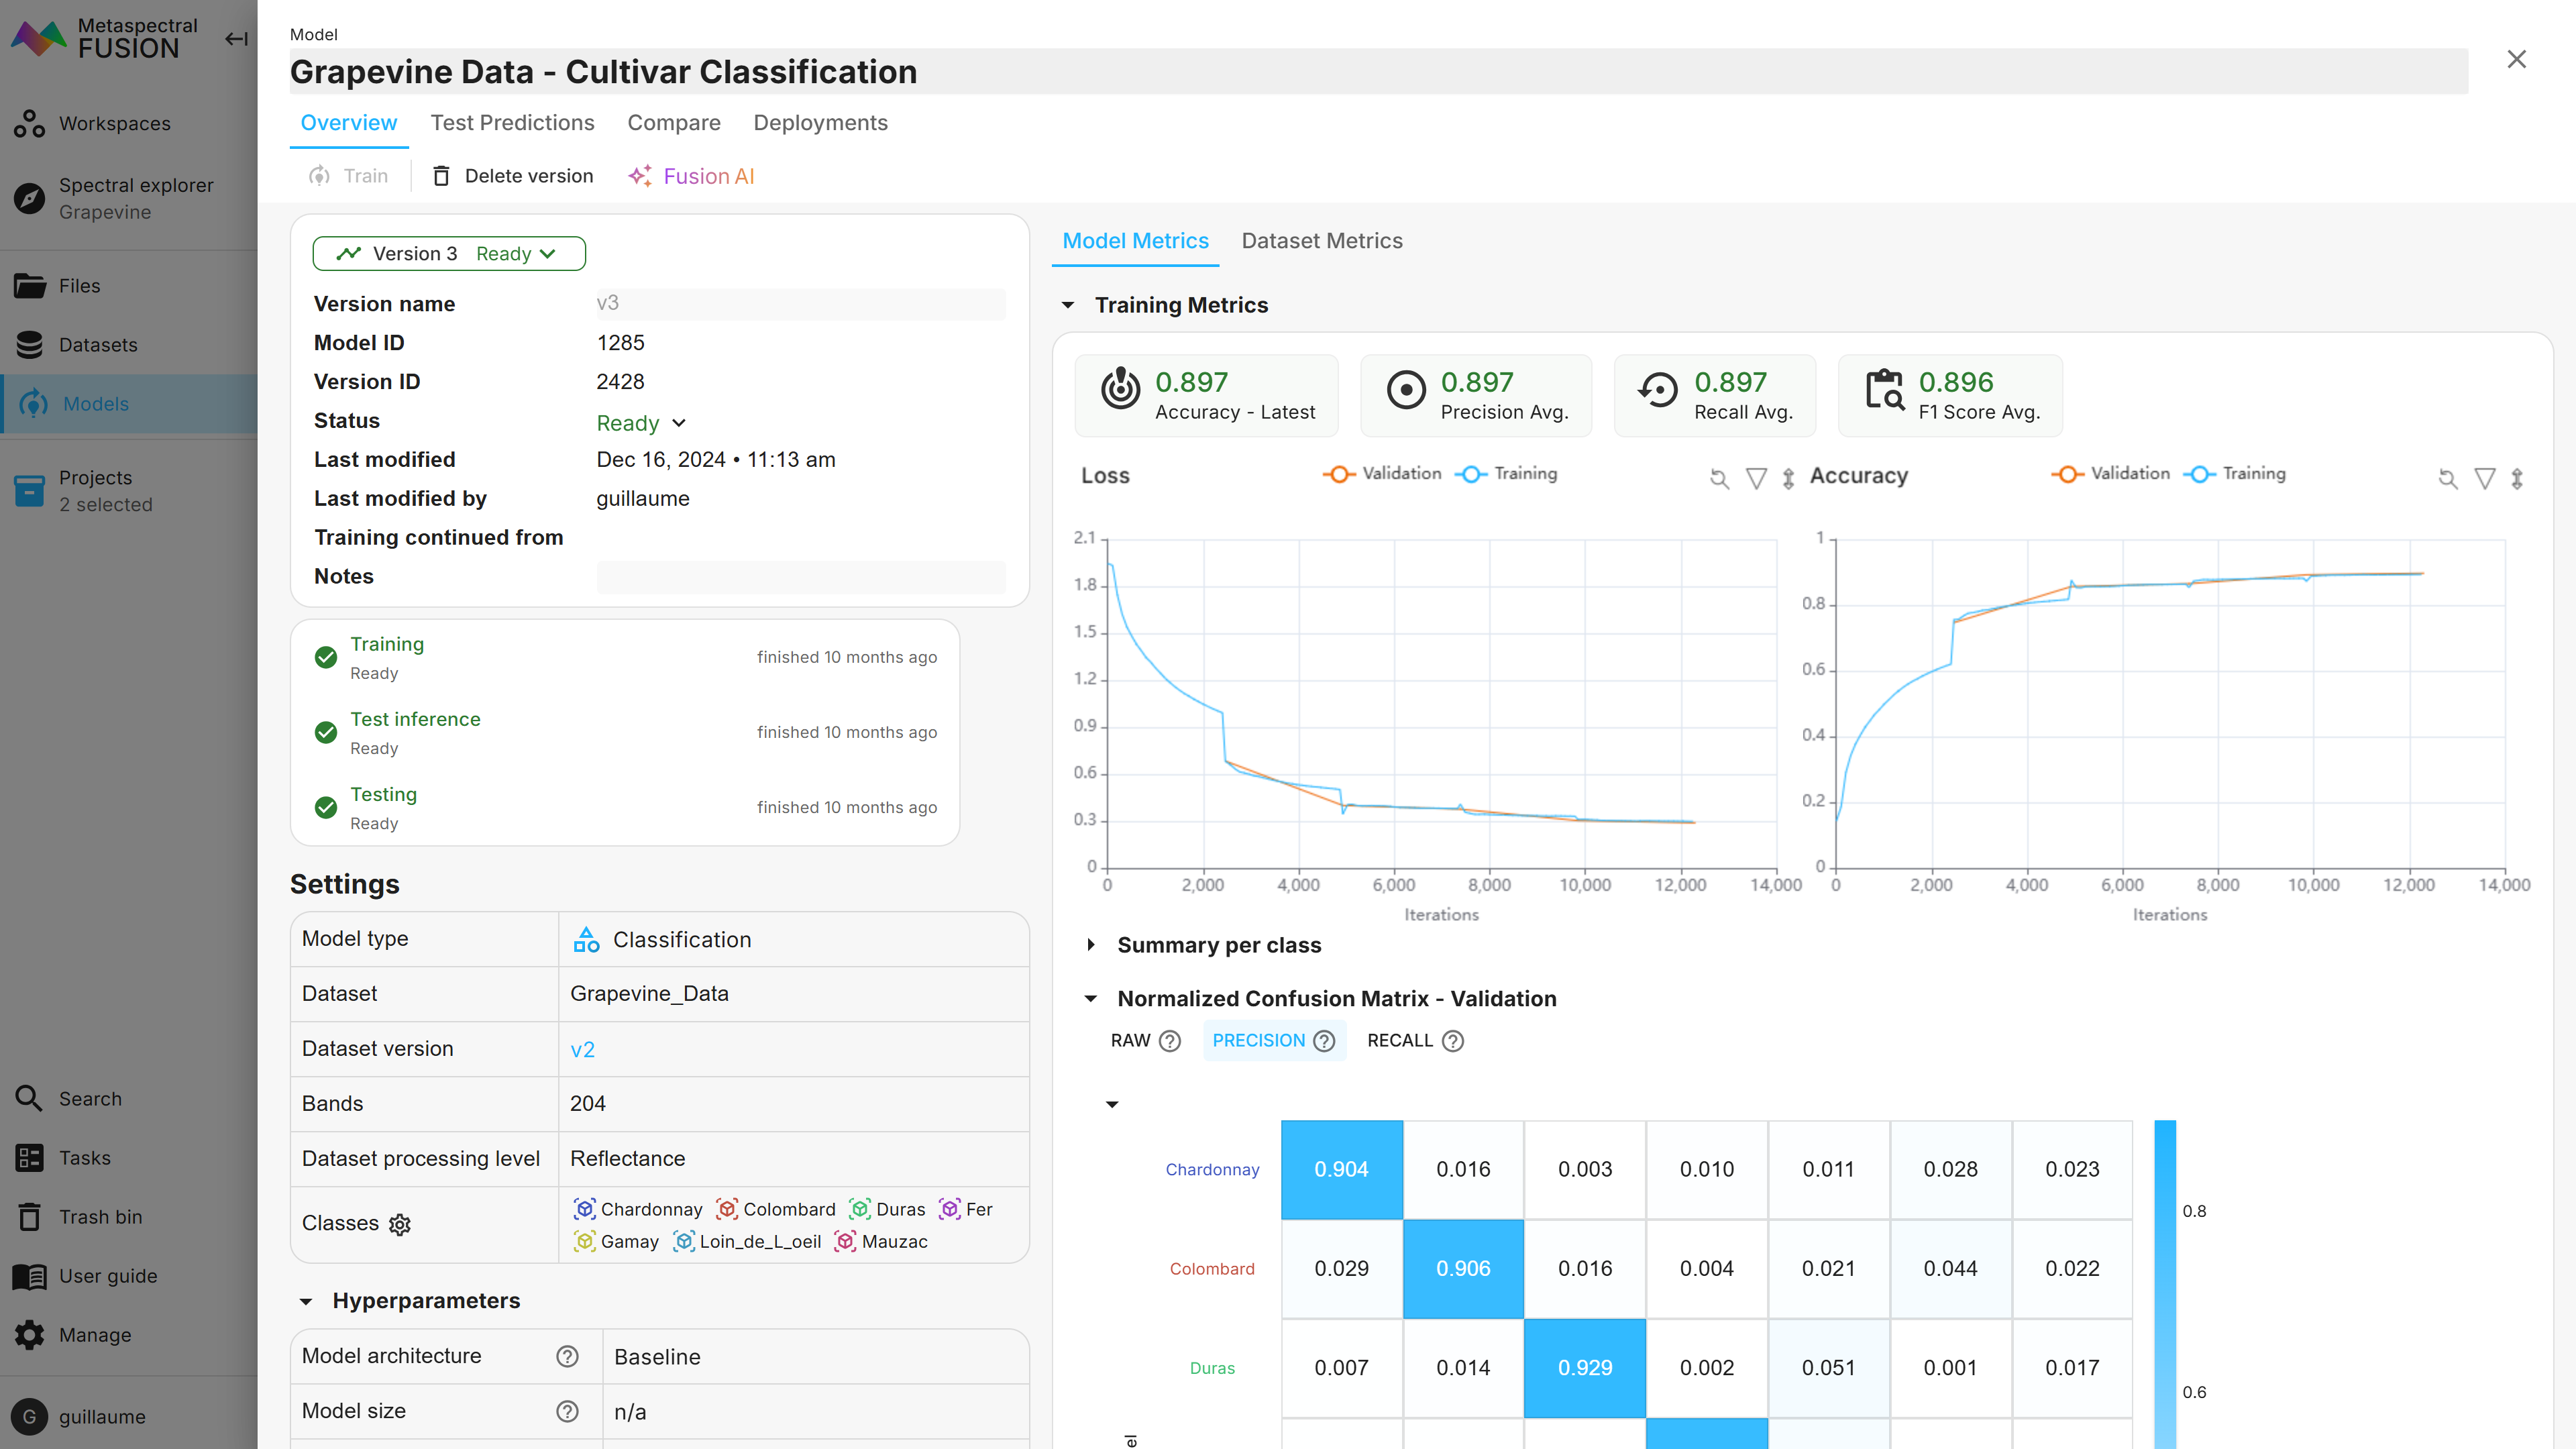
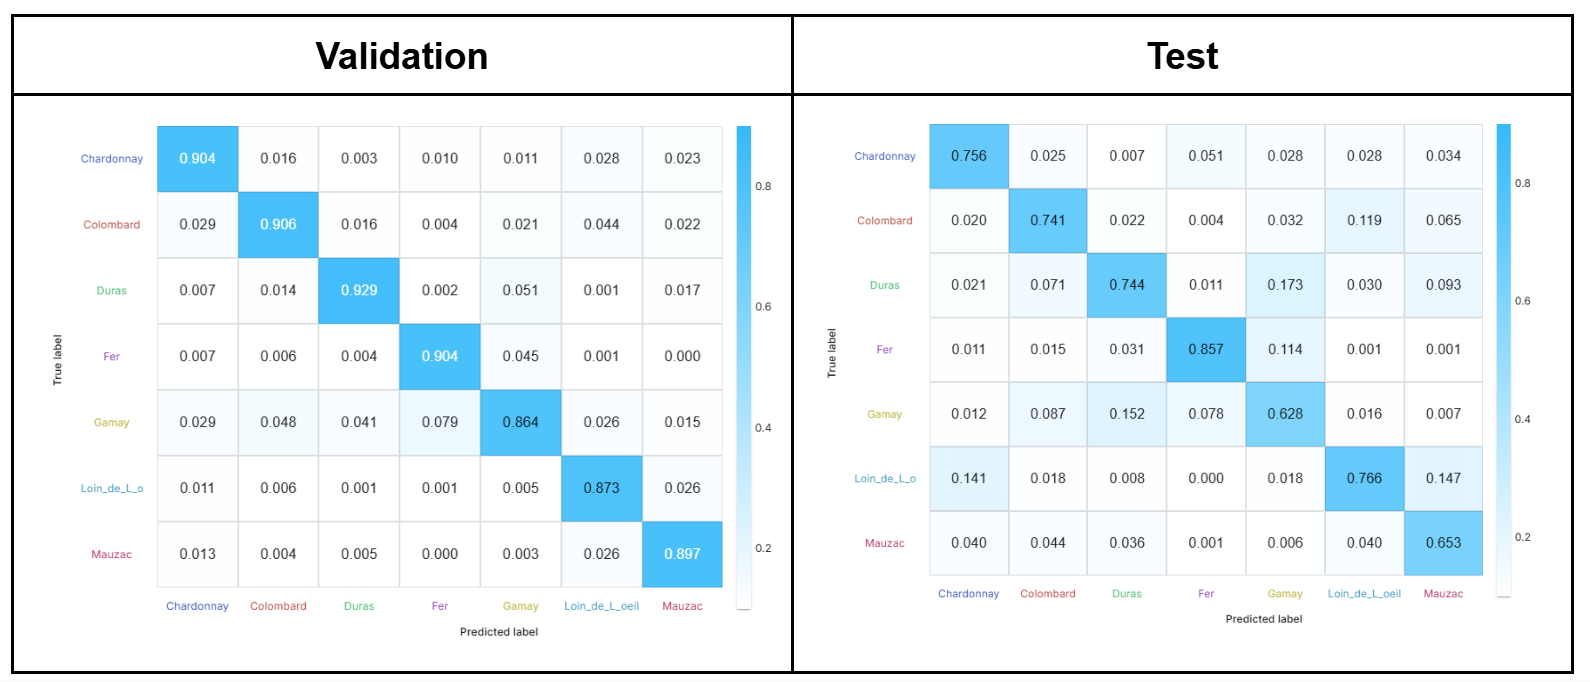
The classification of the grapevine varieties (7 classes) led to overall accuracies of 89.7% and 72.8% on the validation and test sets, respectively. The loss and accuracy of the model according to the number of iterations can be monitored in real time and is shown in Figure 5. The confusion matrices obtained from Fusion for these two subsets are shown in Figure 6.
Regression
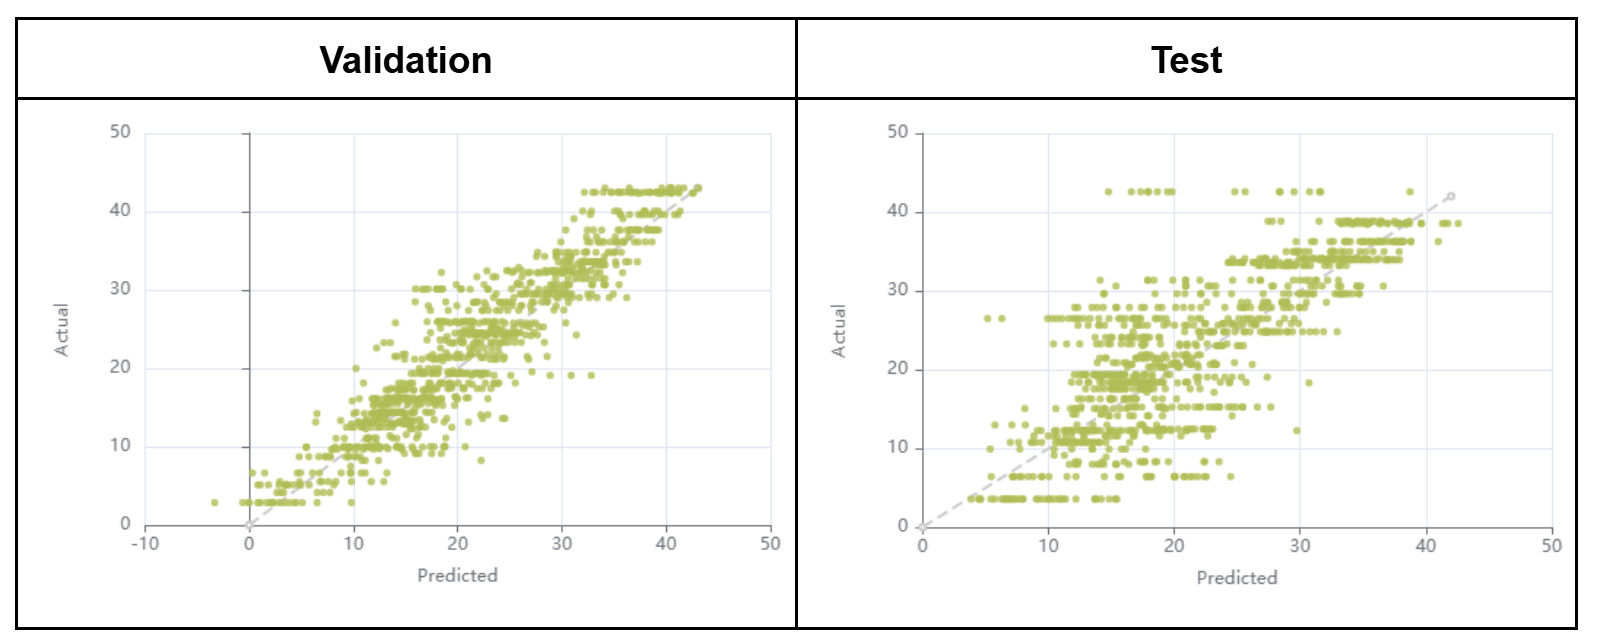
The regression over the grapevine leaves chlorophyll content resulted in R2 of 0.84 and 0.66 and in root mean square errors (RMSE) of 3.94 and 5.89 µg/cm² for the validation and test subsets respectively. The regression models are shown in Figure 7. Note that, for the purpose of the current demonstration, all models were built on a pixel per pixel basis even though only one label and one chlorophyl content value were available per image. However, in the case of the grapevine dataset, the spectra could be averaged for each leaf, which would increase the signal to noise ratio and could potentially lead to improved results. Furthermore, a significant number of leaves presented foliar symptoms caused by grapevine diseases which might also impact the spectra but, for conciseness, were ignored in this analysis.
Target Detection
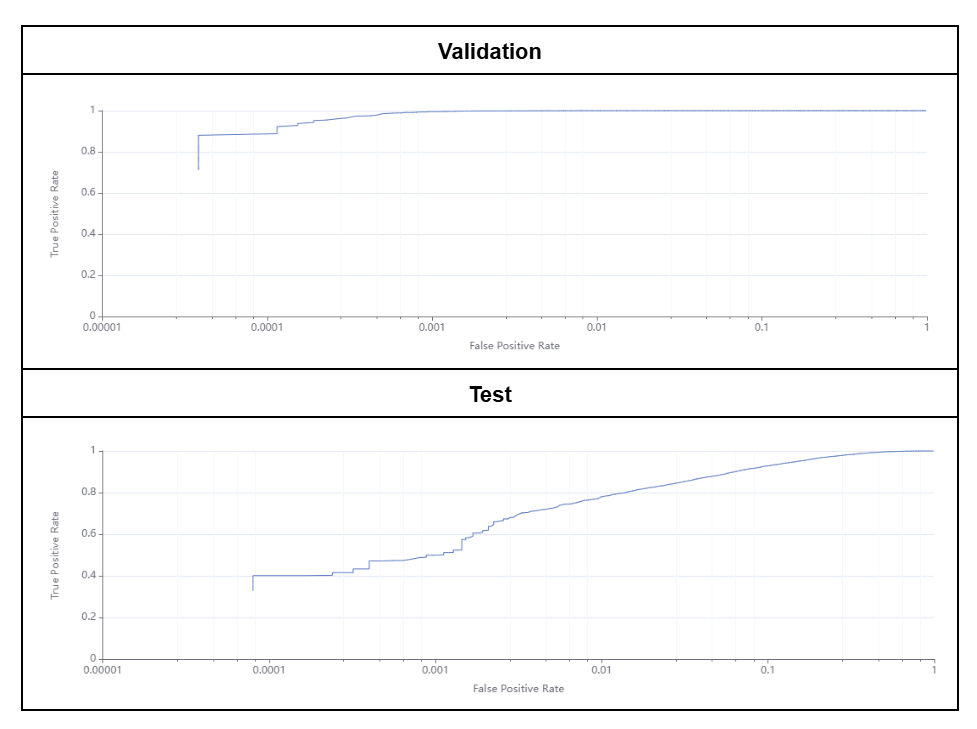
The Blood Stain target detection model achieved 99.8% and 91.9% accuracy for the validation and test subsets, respectively. The Receiver Operating Characteristic (ROC) curves obtained from Fusion are shown in Figure 8. These results are in accordance with the paper published with the Blood Stain dataset which reported overall accuracies ranging between 74 and 100% depending on the model and image set used.
Last words
Through these examples, it was demonstrated that Fusion can efficiently analyze a substantial amount of data and provide actionable insights from hyperspectral images. Fusion is primarily available as a cloud based platform but upon request, can also be installed on premise. Nevertheless, the cloud based platform presents at least two significant additional advantages. First, the data can seamlessly be shared with colleagues and collaborators wherever they are and even distributed to third parties or clients in an easy and rapid manner. Second, on the cloud, Fusion has access to significant resources (CPU, GPU, and TPU) providing unparalleled computing capabilities and speeding up most operations. Finally, for those interested in industrial applications, models developed on the Fusion cloud-based platform can be deployed on-site on a dedicated base-station with custom dashboards allowing to visualize live inferences for real-time analysis.